Logs
In this guide, you'll learn how to view and manage your Cloud environment's logs.
Logs Overview#
Logs are output messages from your Medusa application's build and runtime processes for a Cloud environment's deployments.
They include messages logged throughout your application's lifecycle, including messages during the build process, application startup, and runtime operations.
Logs are essential for monitoring your application's health and debugging issues that may arise during development, deployment, or when the application is running in production.
Log Types#
There are two types of logs for your environment's deployments:
- Build logs: Messages generated during the build process before deploying and starting the application. These logs are useful for debugging when a deployment's build fails.
- Runtime logs: Messages logged by the Medusa backend and storefront when they start and while they're running, such as informational startup messages, HTTP requests, errors, and more. These logs are useful for debugging the application's deployment and runtime errors.
View Build Logs on Cloud#
Build logs help you identify issues when a deployment fails with the status "Build failed". They can help you debug the build process and understand why the deployment didn't succeed.
You can view the build logs for any deployment in your environment, including older deployments.
To view the build logs for a deployment:
- Make sure you're viewing the correct organization's dashboard in Cloud.
- Click on the project that the deployment belongs to.
- Click on the environment that the deployment belongs to, such as "Production".
- In the "Deployments" table, find the deployment you want to view the build logs for and click on it.
This will open the deployment details page, where you can see the deployment's activity:
- Backend build logs: Logs for building the Medusa backend.
- Storefront build logs: If you deployed a storefront alongside the Medusa application, this shows the logs for building the storefront.
The build logs are updated in real time as the build process runs, so you can see the progress and any errors that occur during the build.

Search Build Logs on Cloud#
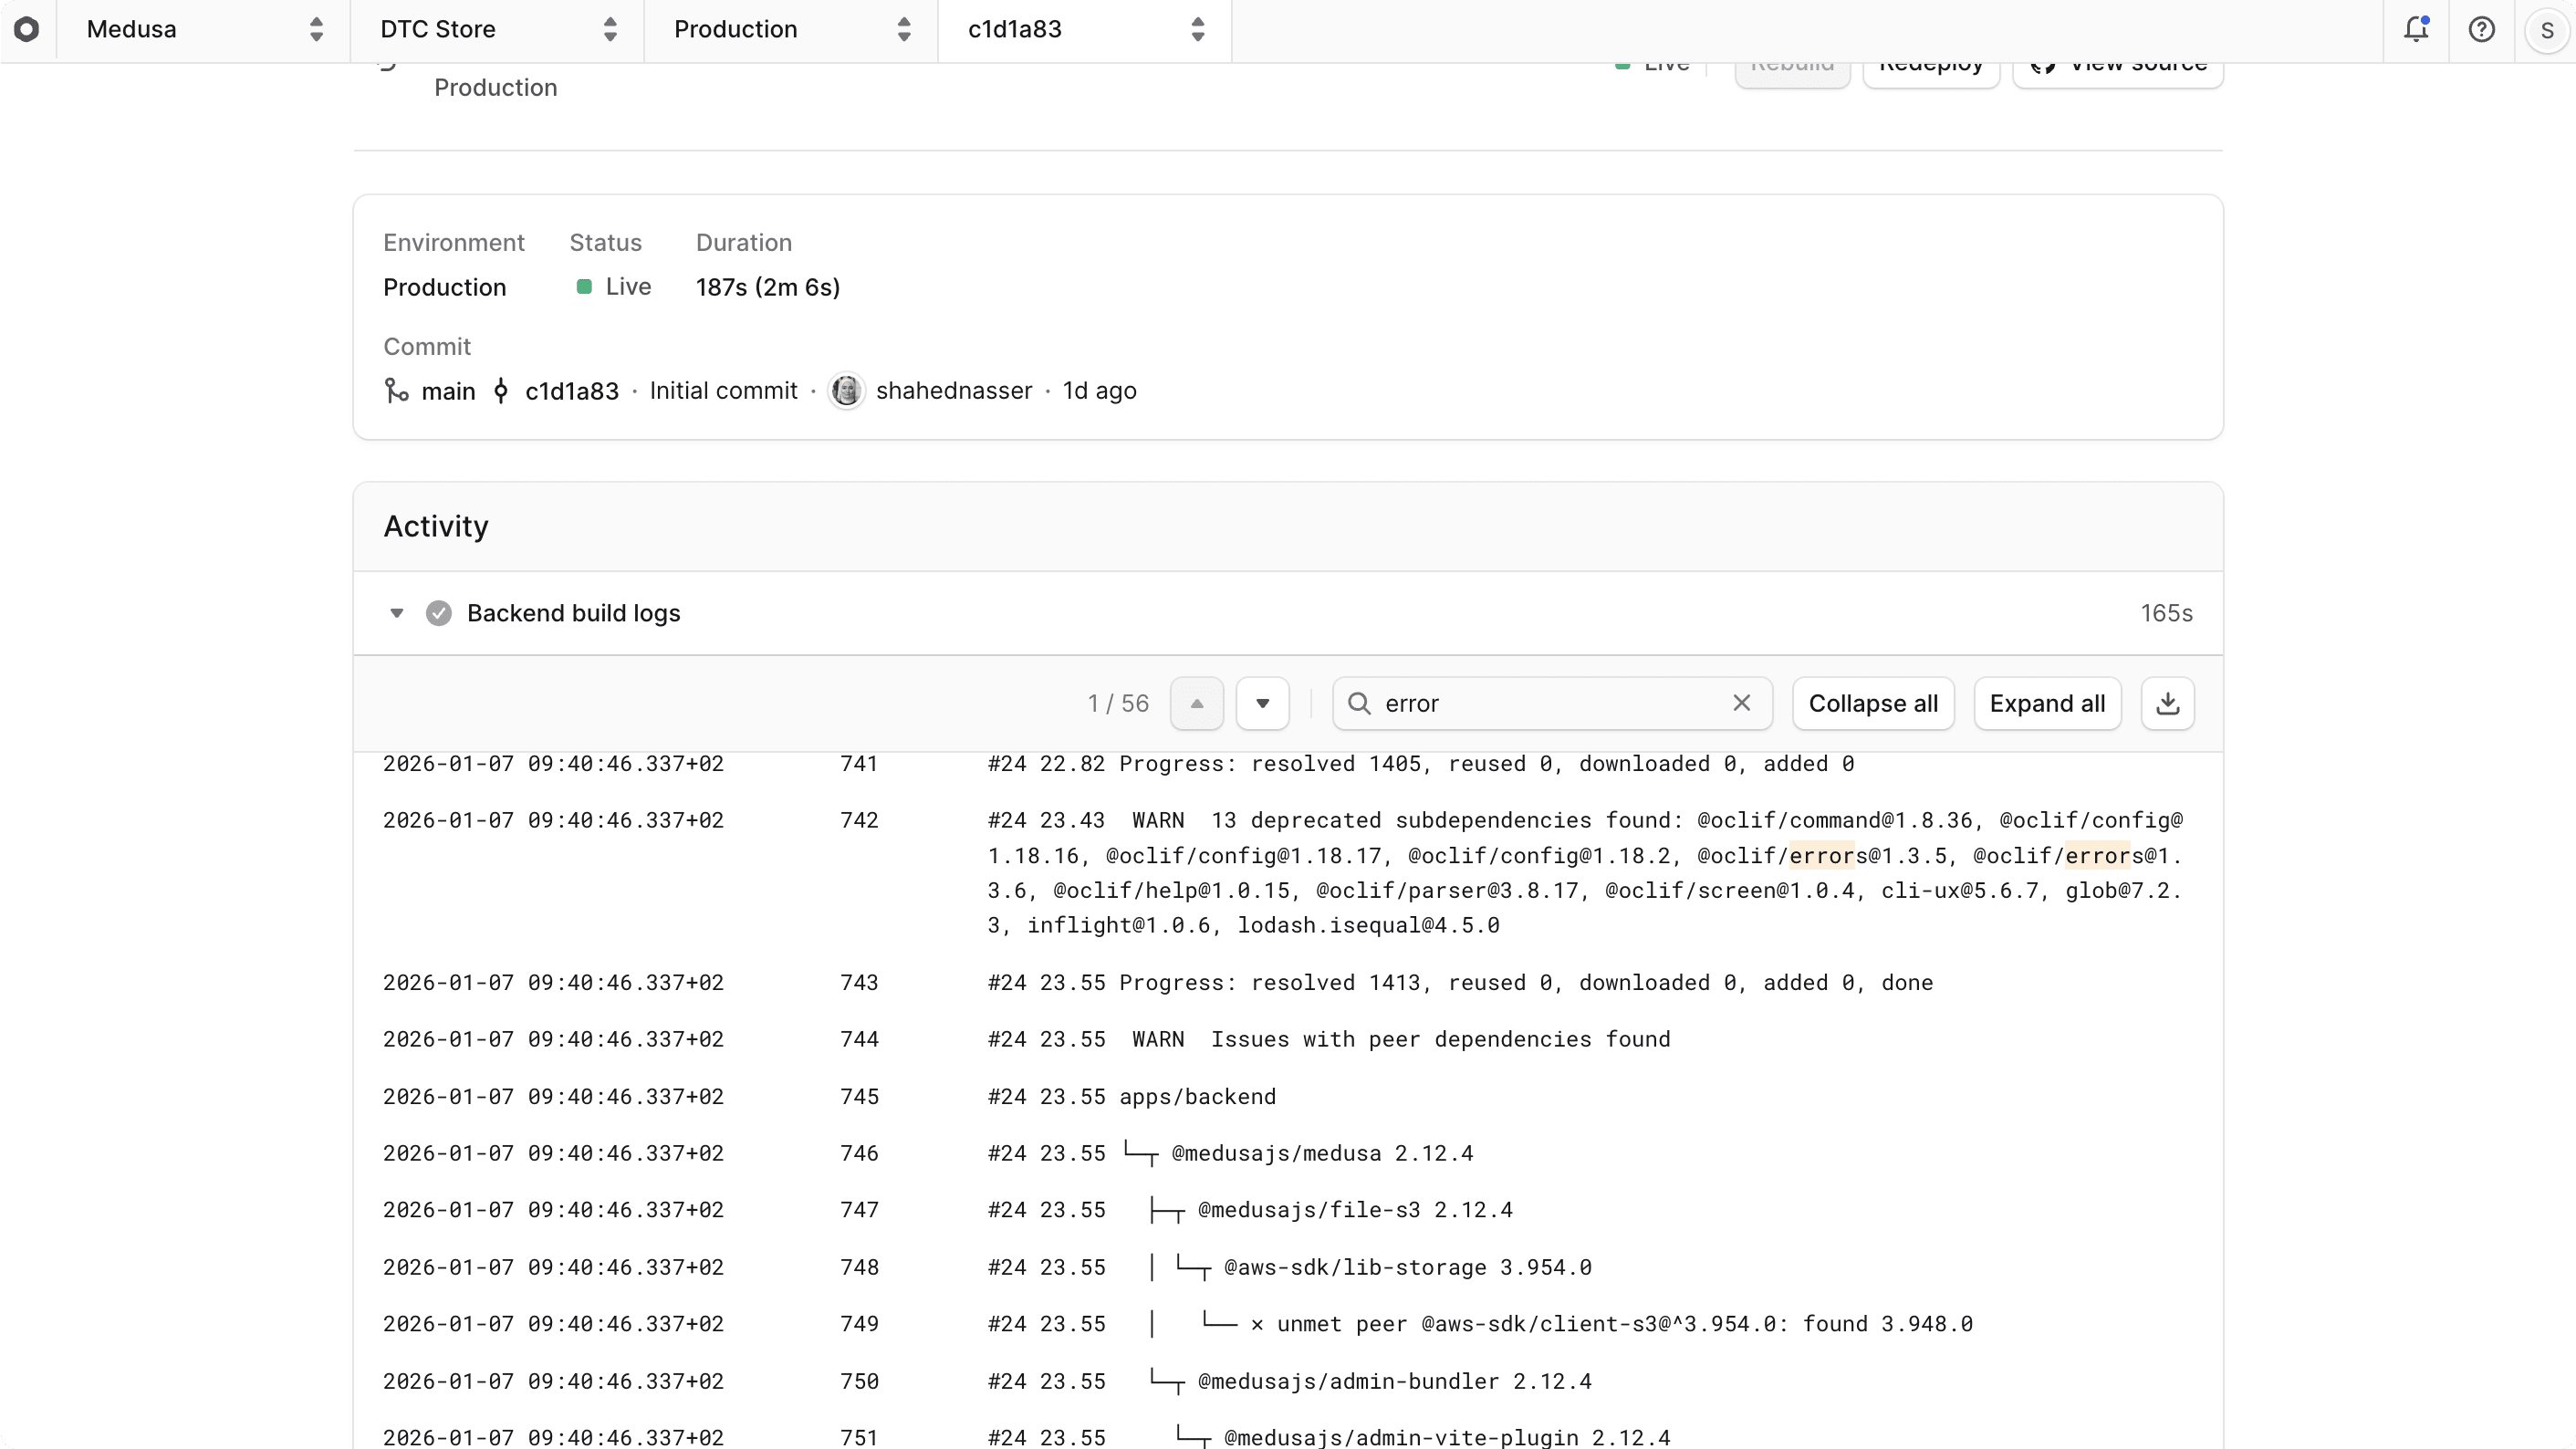
You can search the build logs (for backend and storefront) using the search bar at the top right of the logs. This is useful for finding specific messages or errors in the logs.
For example, you can search for keywords like "error" or "warning" to quickly locate issues in the build process.
When you enter the search term, you'll see how the results matching your search. You can move between the results using the up and down arrows next to the search bar. The matching text will be highlighted in the logs.
Expand and Collapse Build Logs on Cloud#
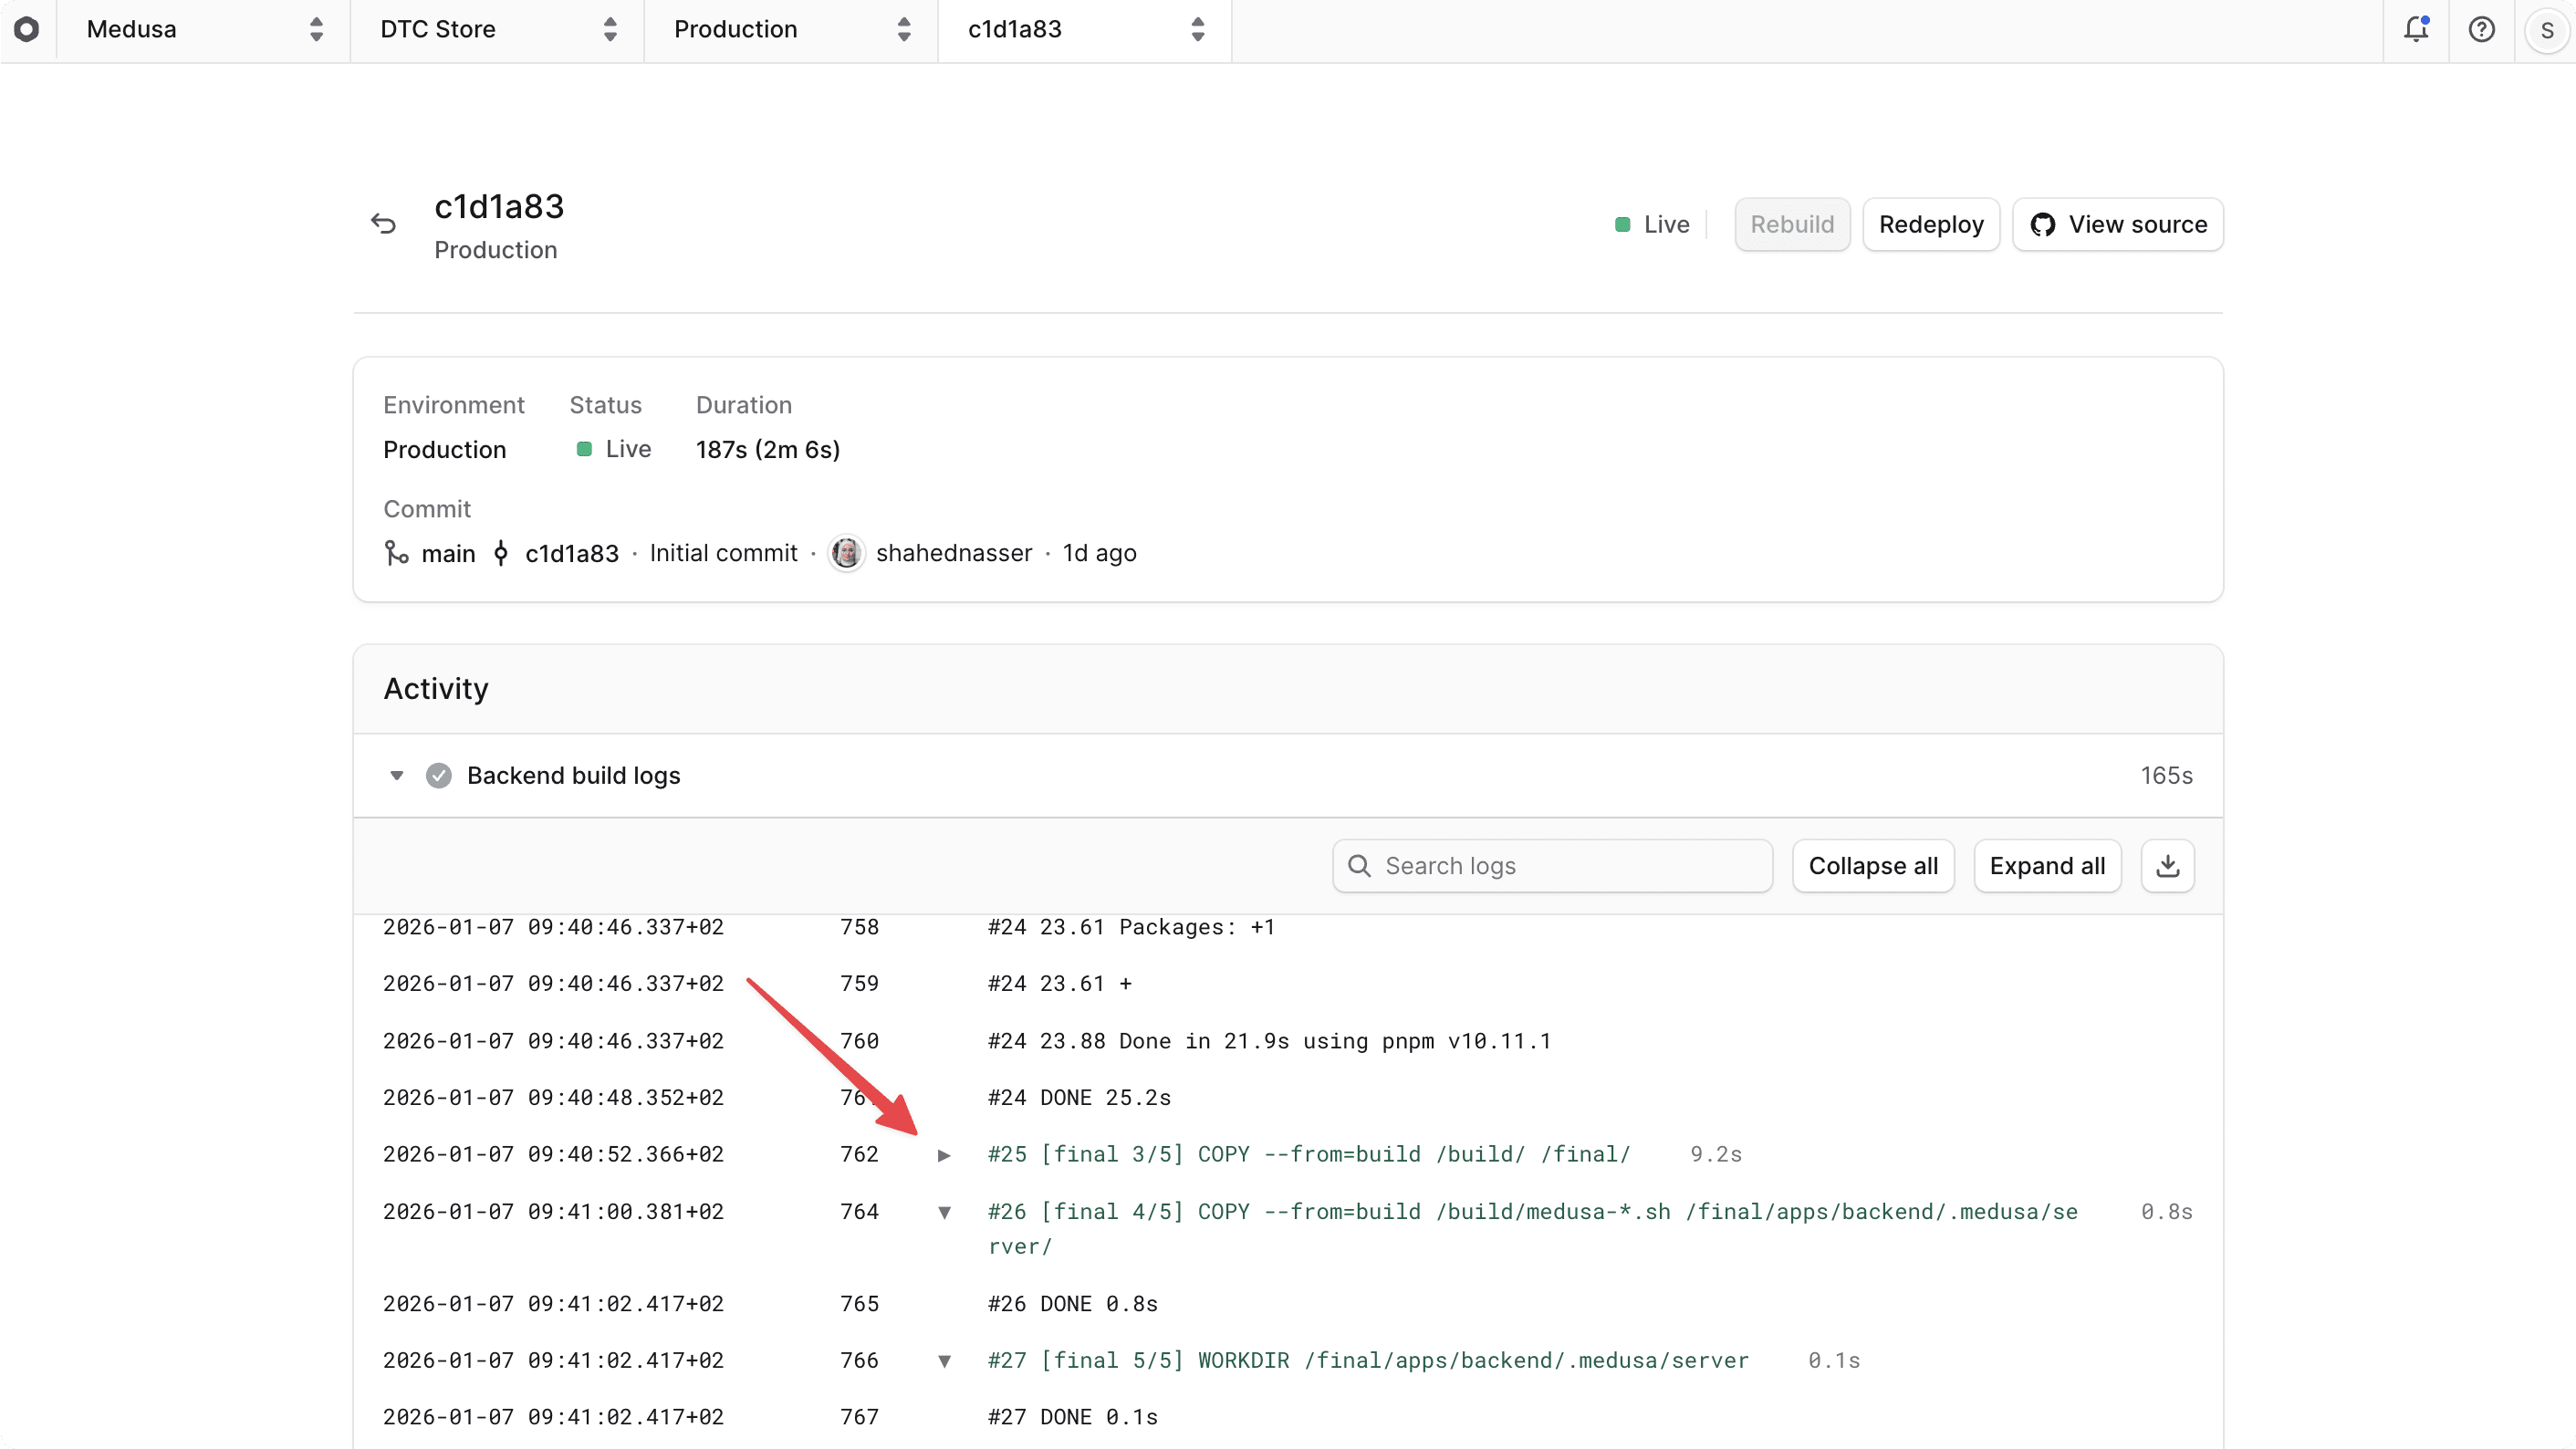
Logs for steps in the build process can be expanded or collapsed to improve readability. This is useful when you have many log messages and want to focus on specific parts of the build process.
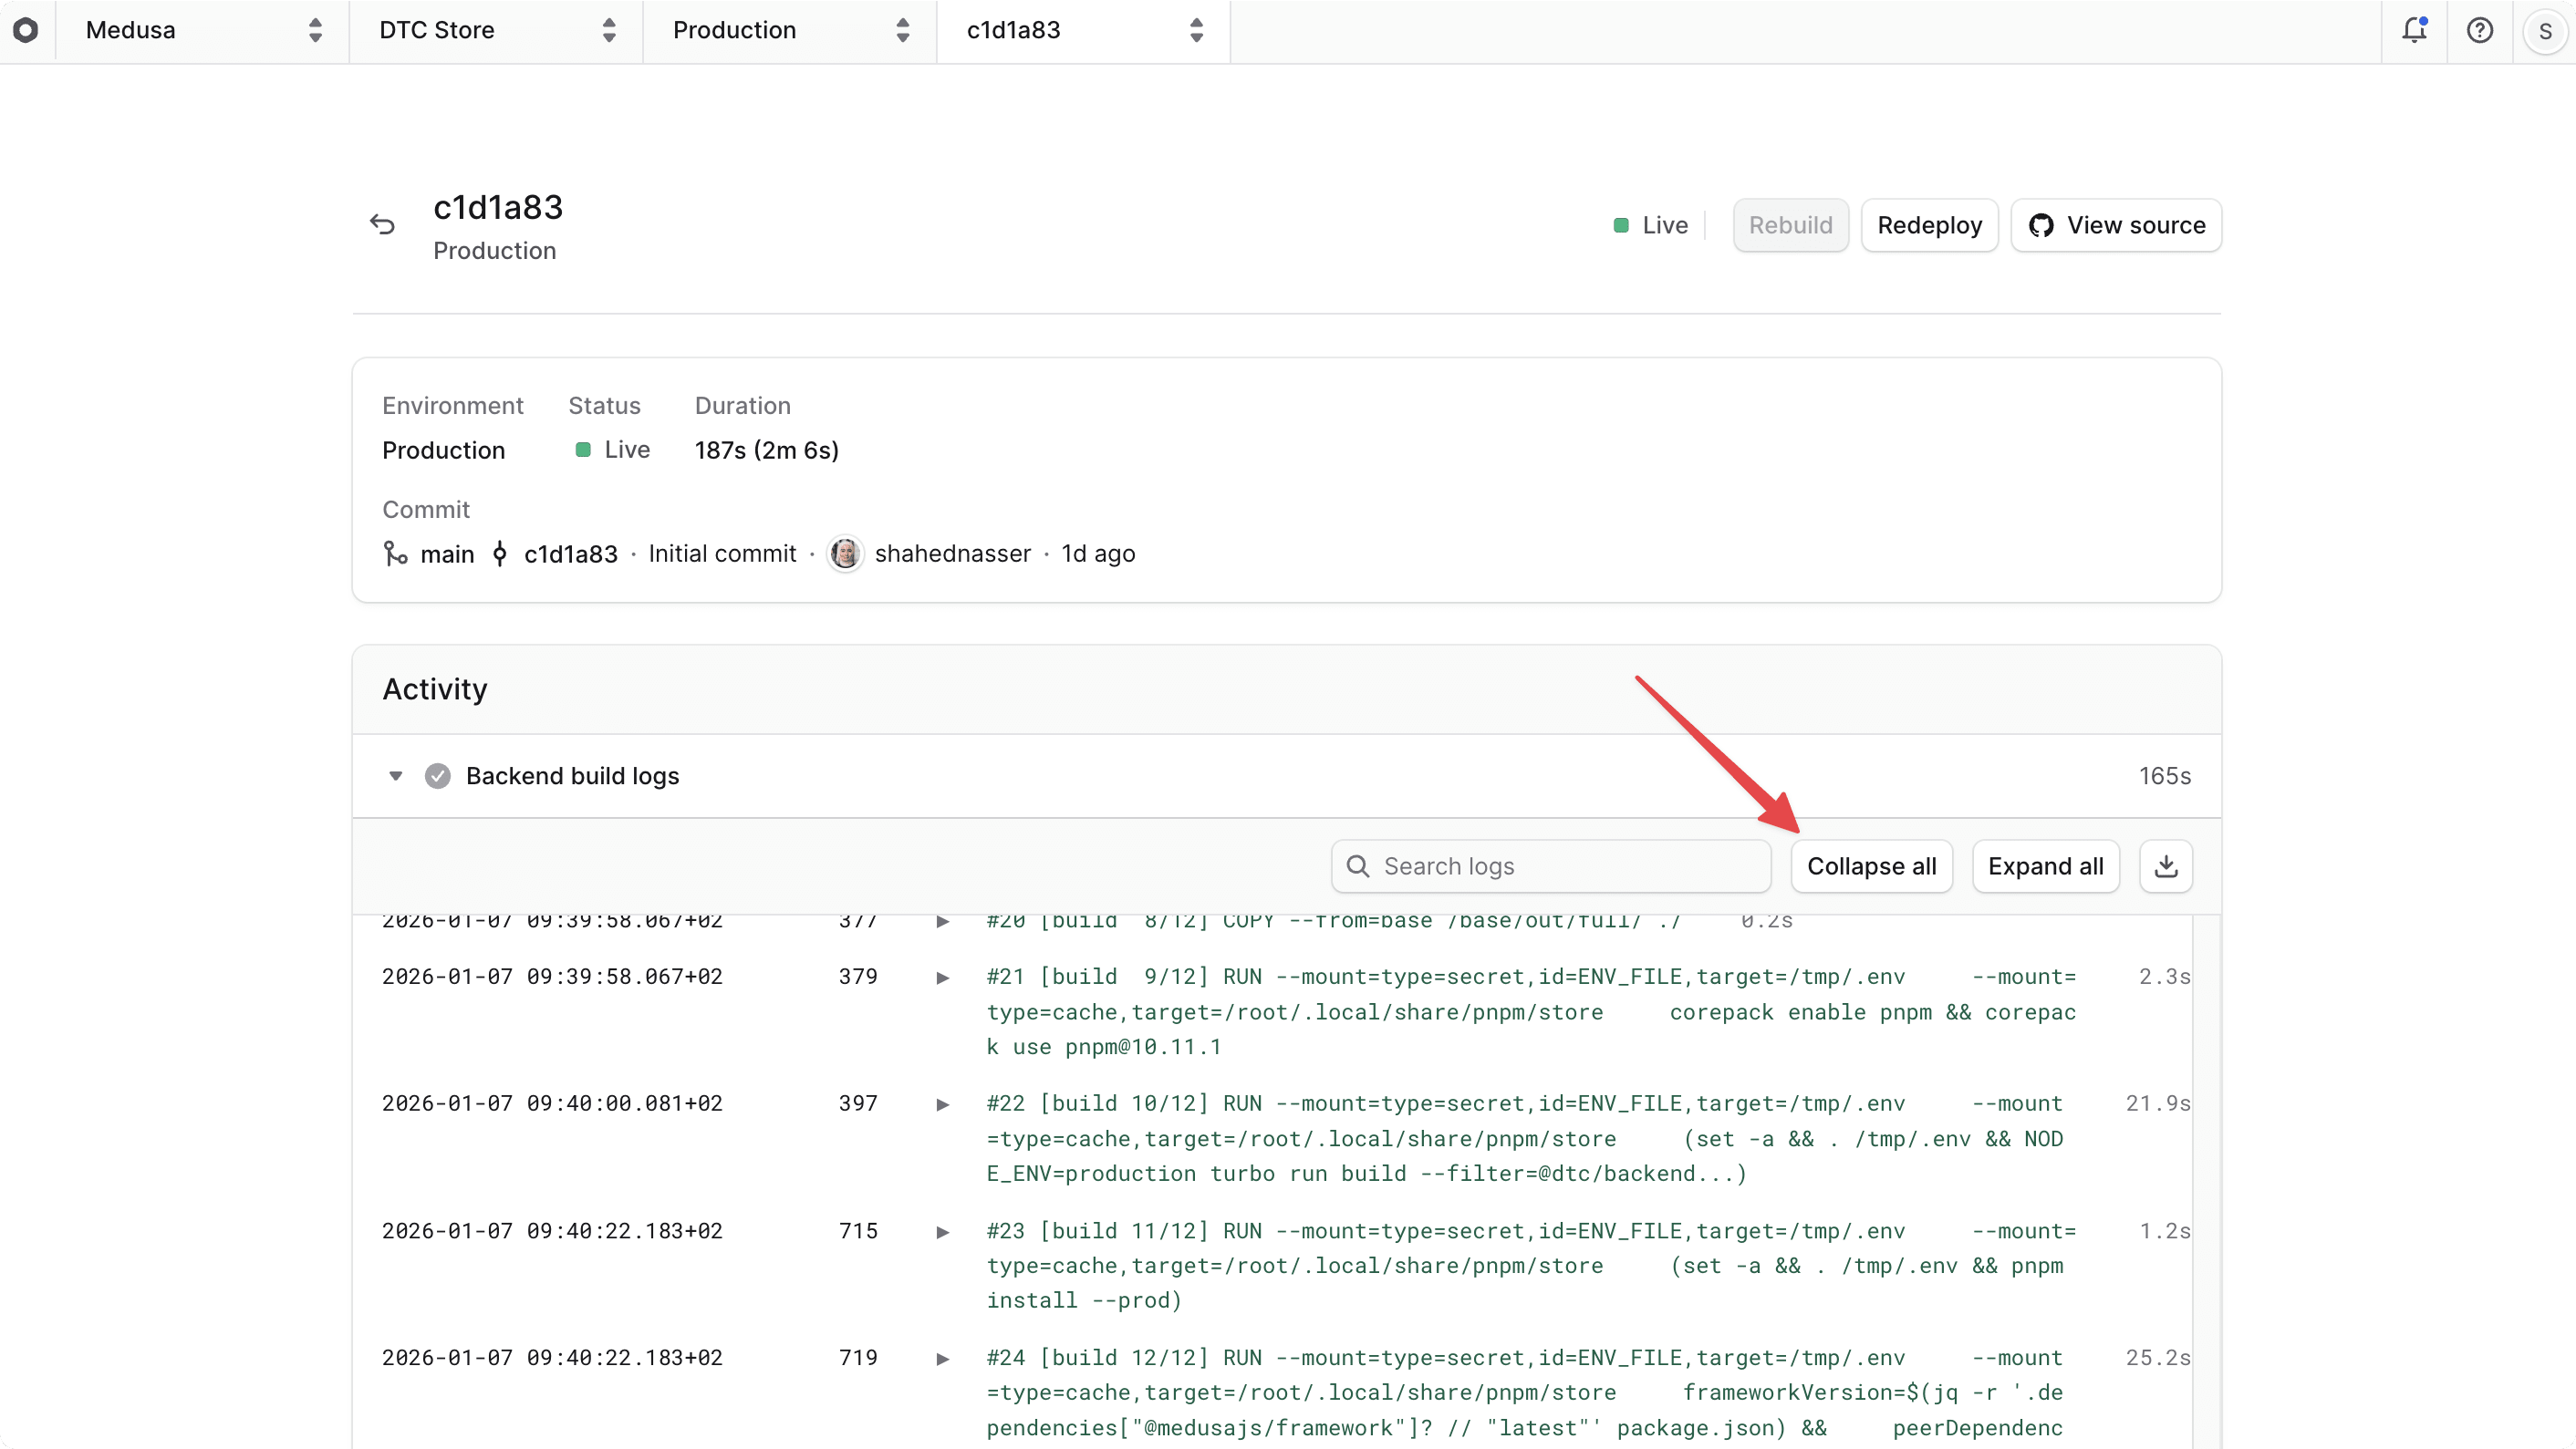
By default, logs for all steps in the build process are expanded. You can collapse all logs by clicking the "Collapse all" button at the top right of the logs. This will hide all the detailed logs and only show the titles of each step.
You can also expand the logs of all steps in the build process by clicking the "Expand all" button at the top right. This will show all the detailed logs for each step.
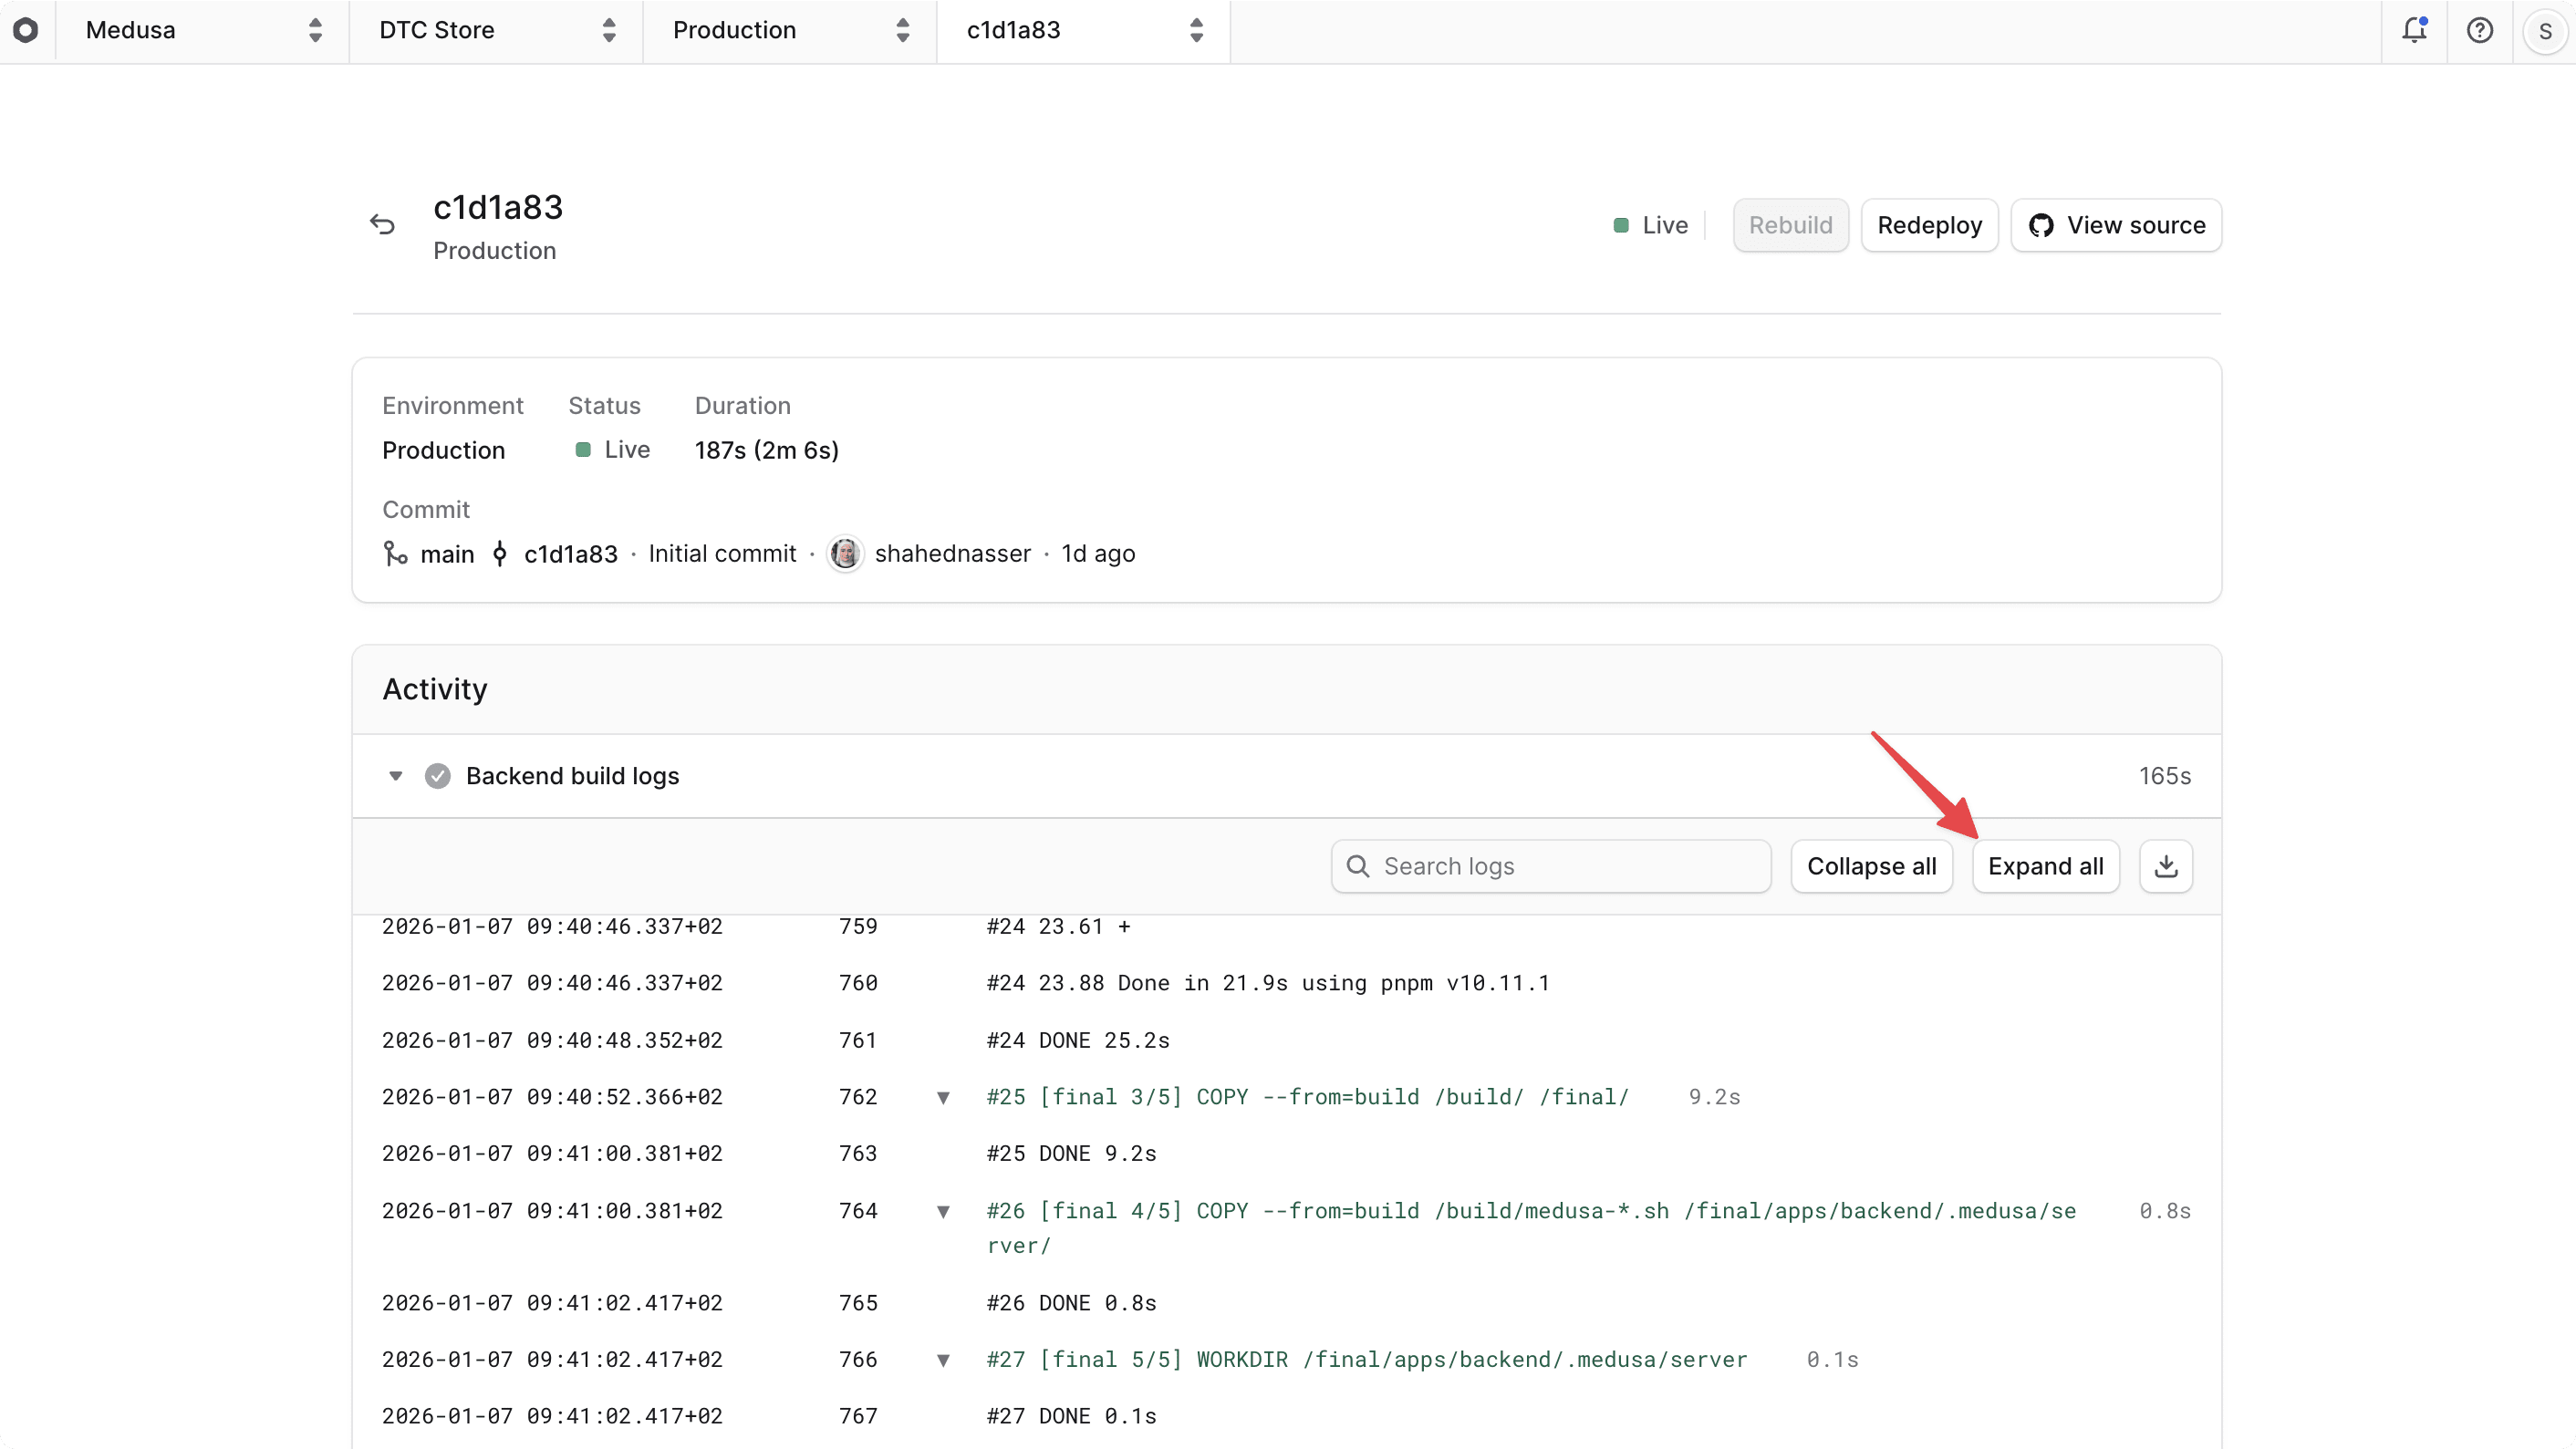
In addition, you can expand or collapse individual steps by clicking the arrow next to a step's title. This gives you more control over which parts of the logs you want to see or hide.
Pause Build Logs on Cloud#
When you view the build logs while the build is still in progress, you can pause the logs to stop them from updating in real time. This is useful if you find a log message that you want to read more closely without it being pushed out of view by new log messages.
To pause the build logs, click the "Pause" button at the bottom right of the page. This button is only shown when there are incoming log messages. When you pause the logs, the button will change to "Resume", allowing you to resume the live log updates.
Download Build Logs on Cloud#
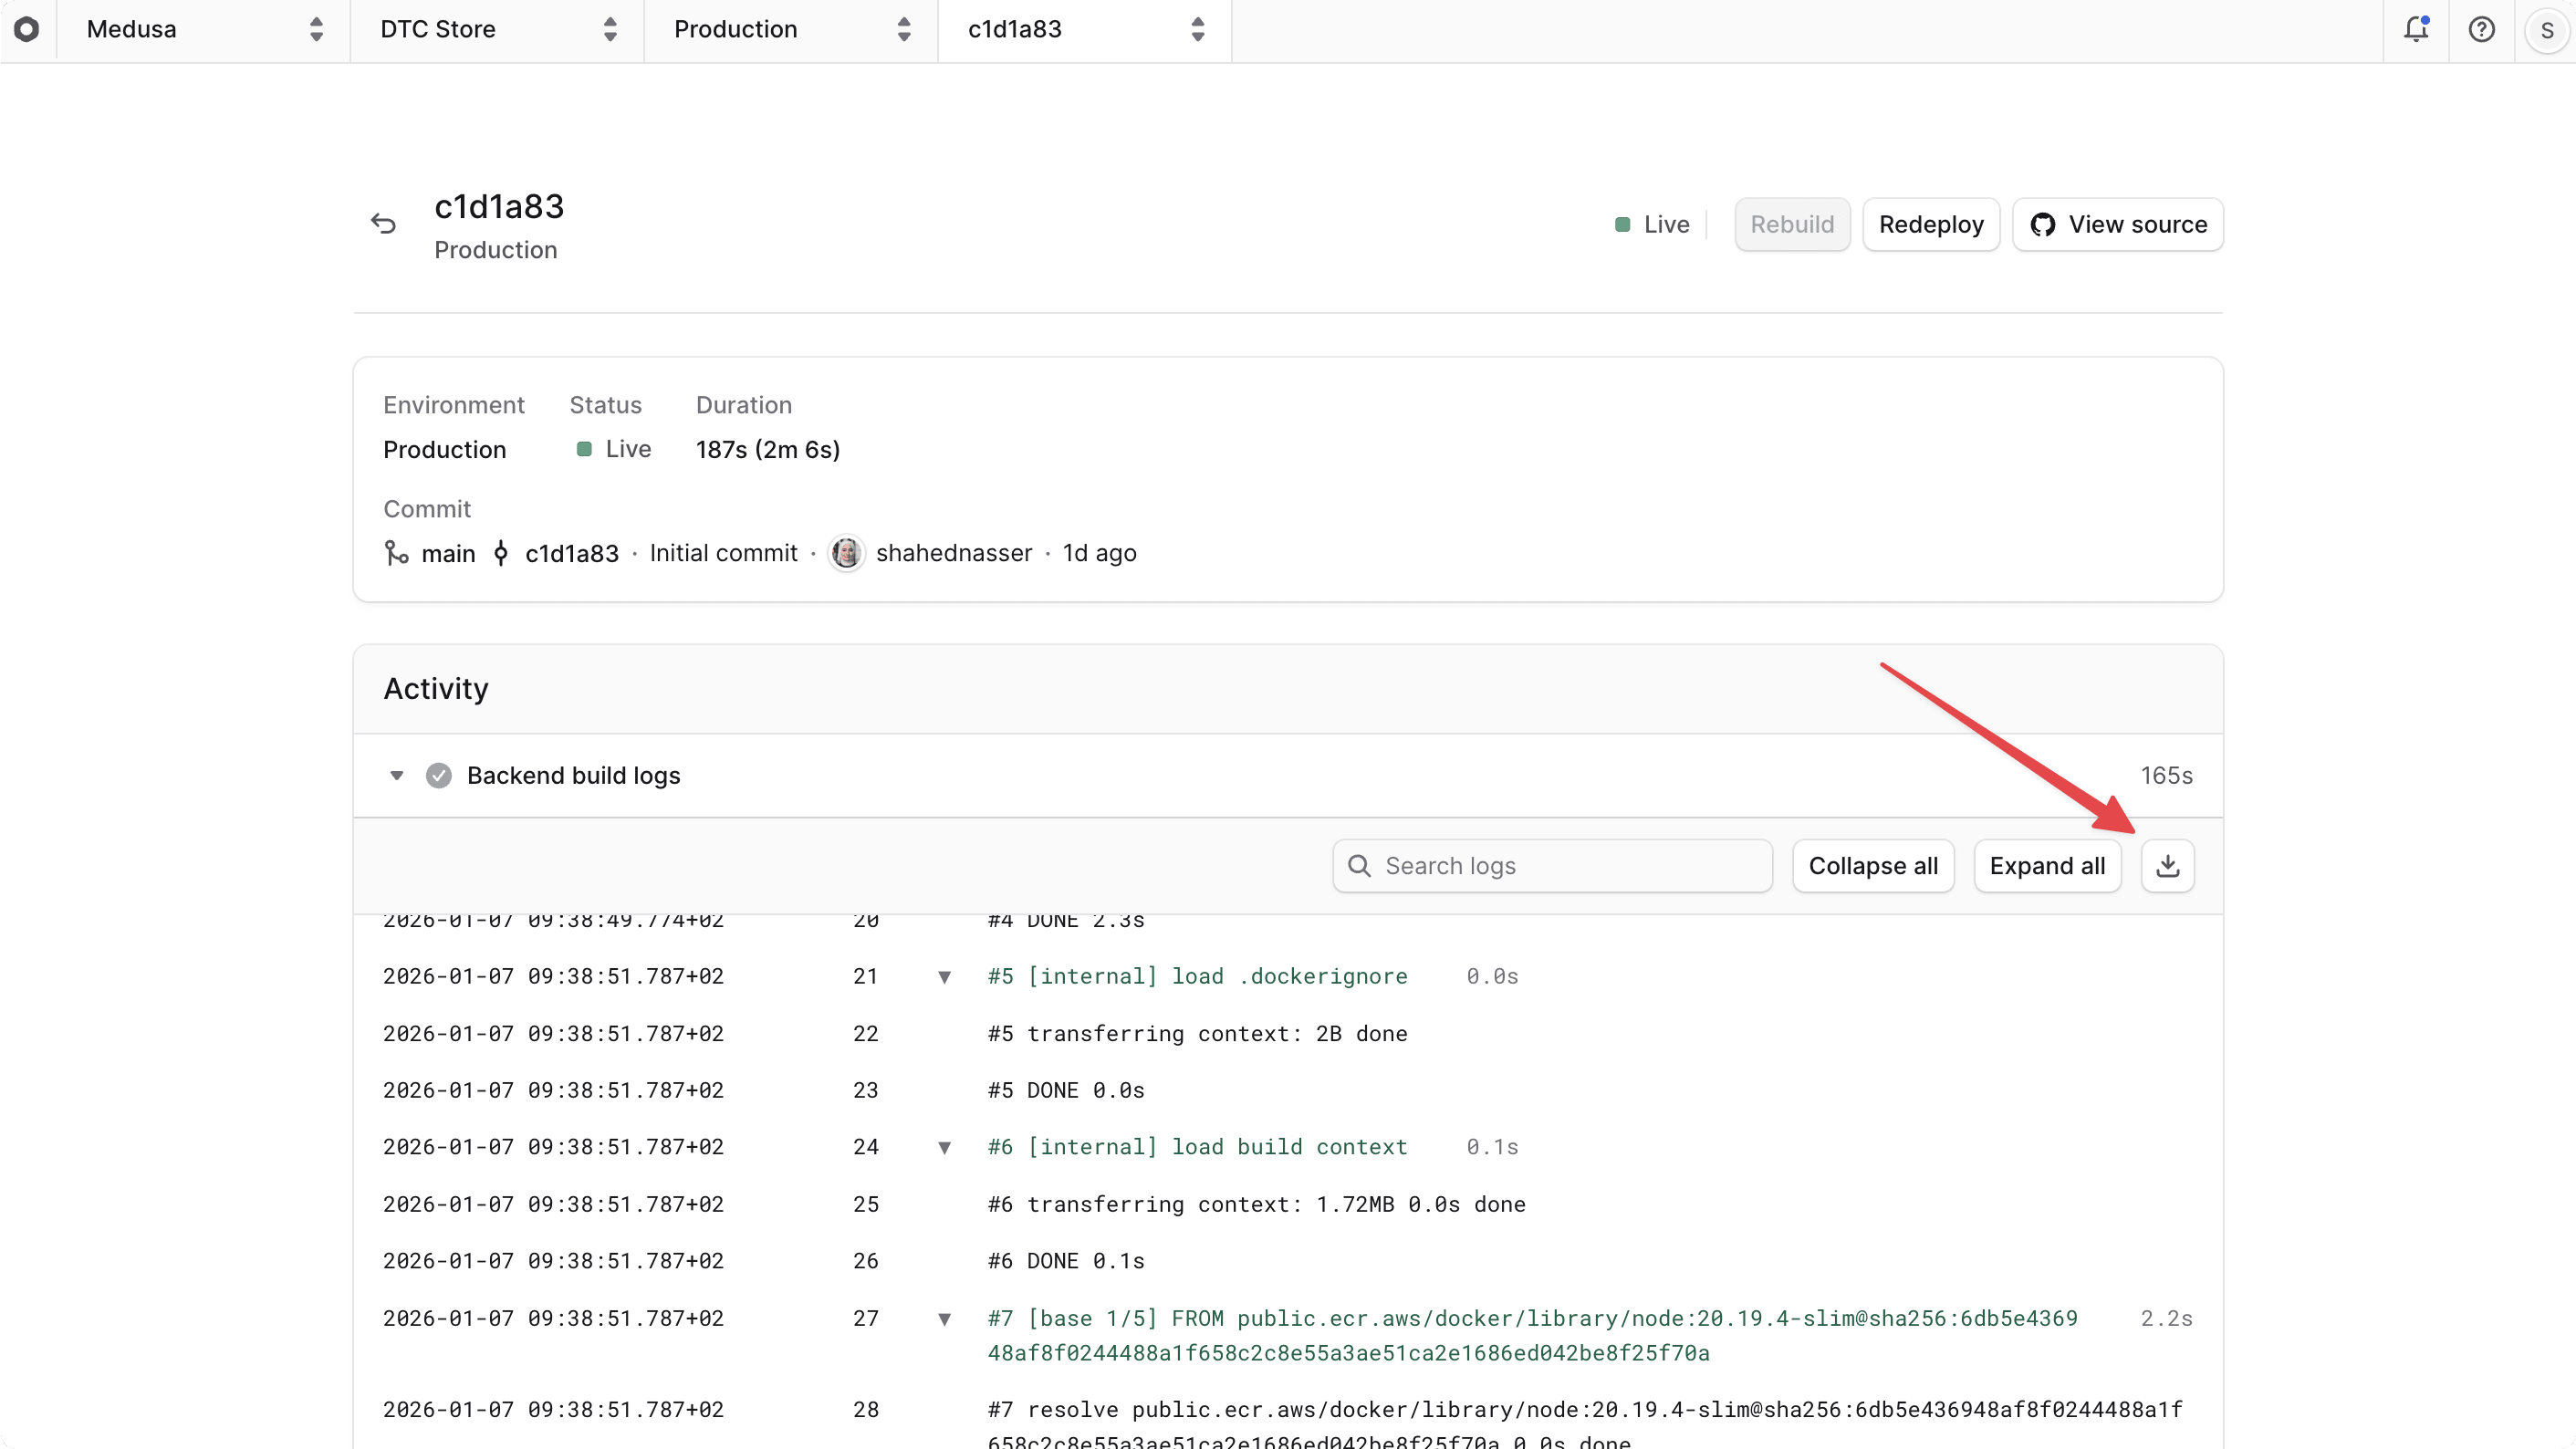
You can download the build logs as a .log file for offline analysis, sharing with your team, or sharing with Cloud support if you need help debugging a build issue.
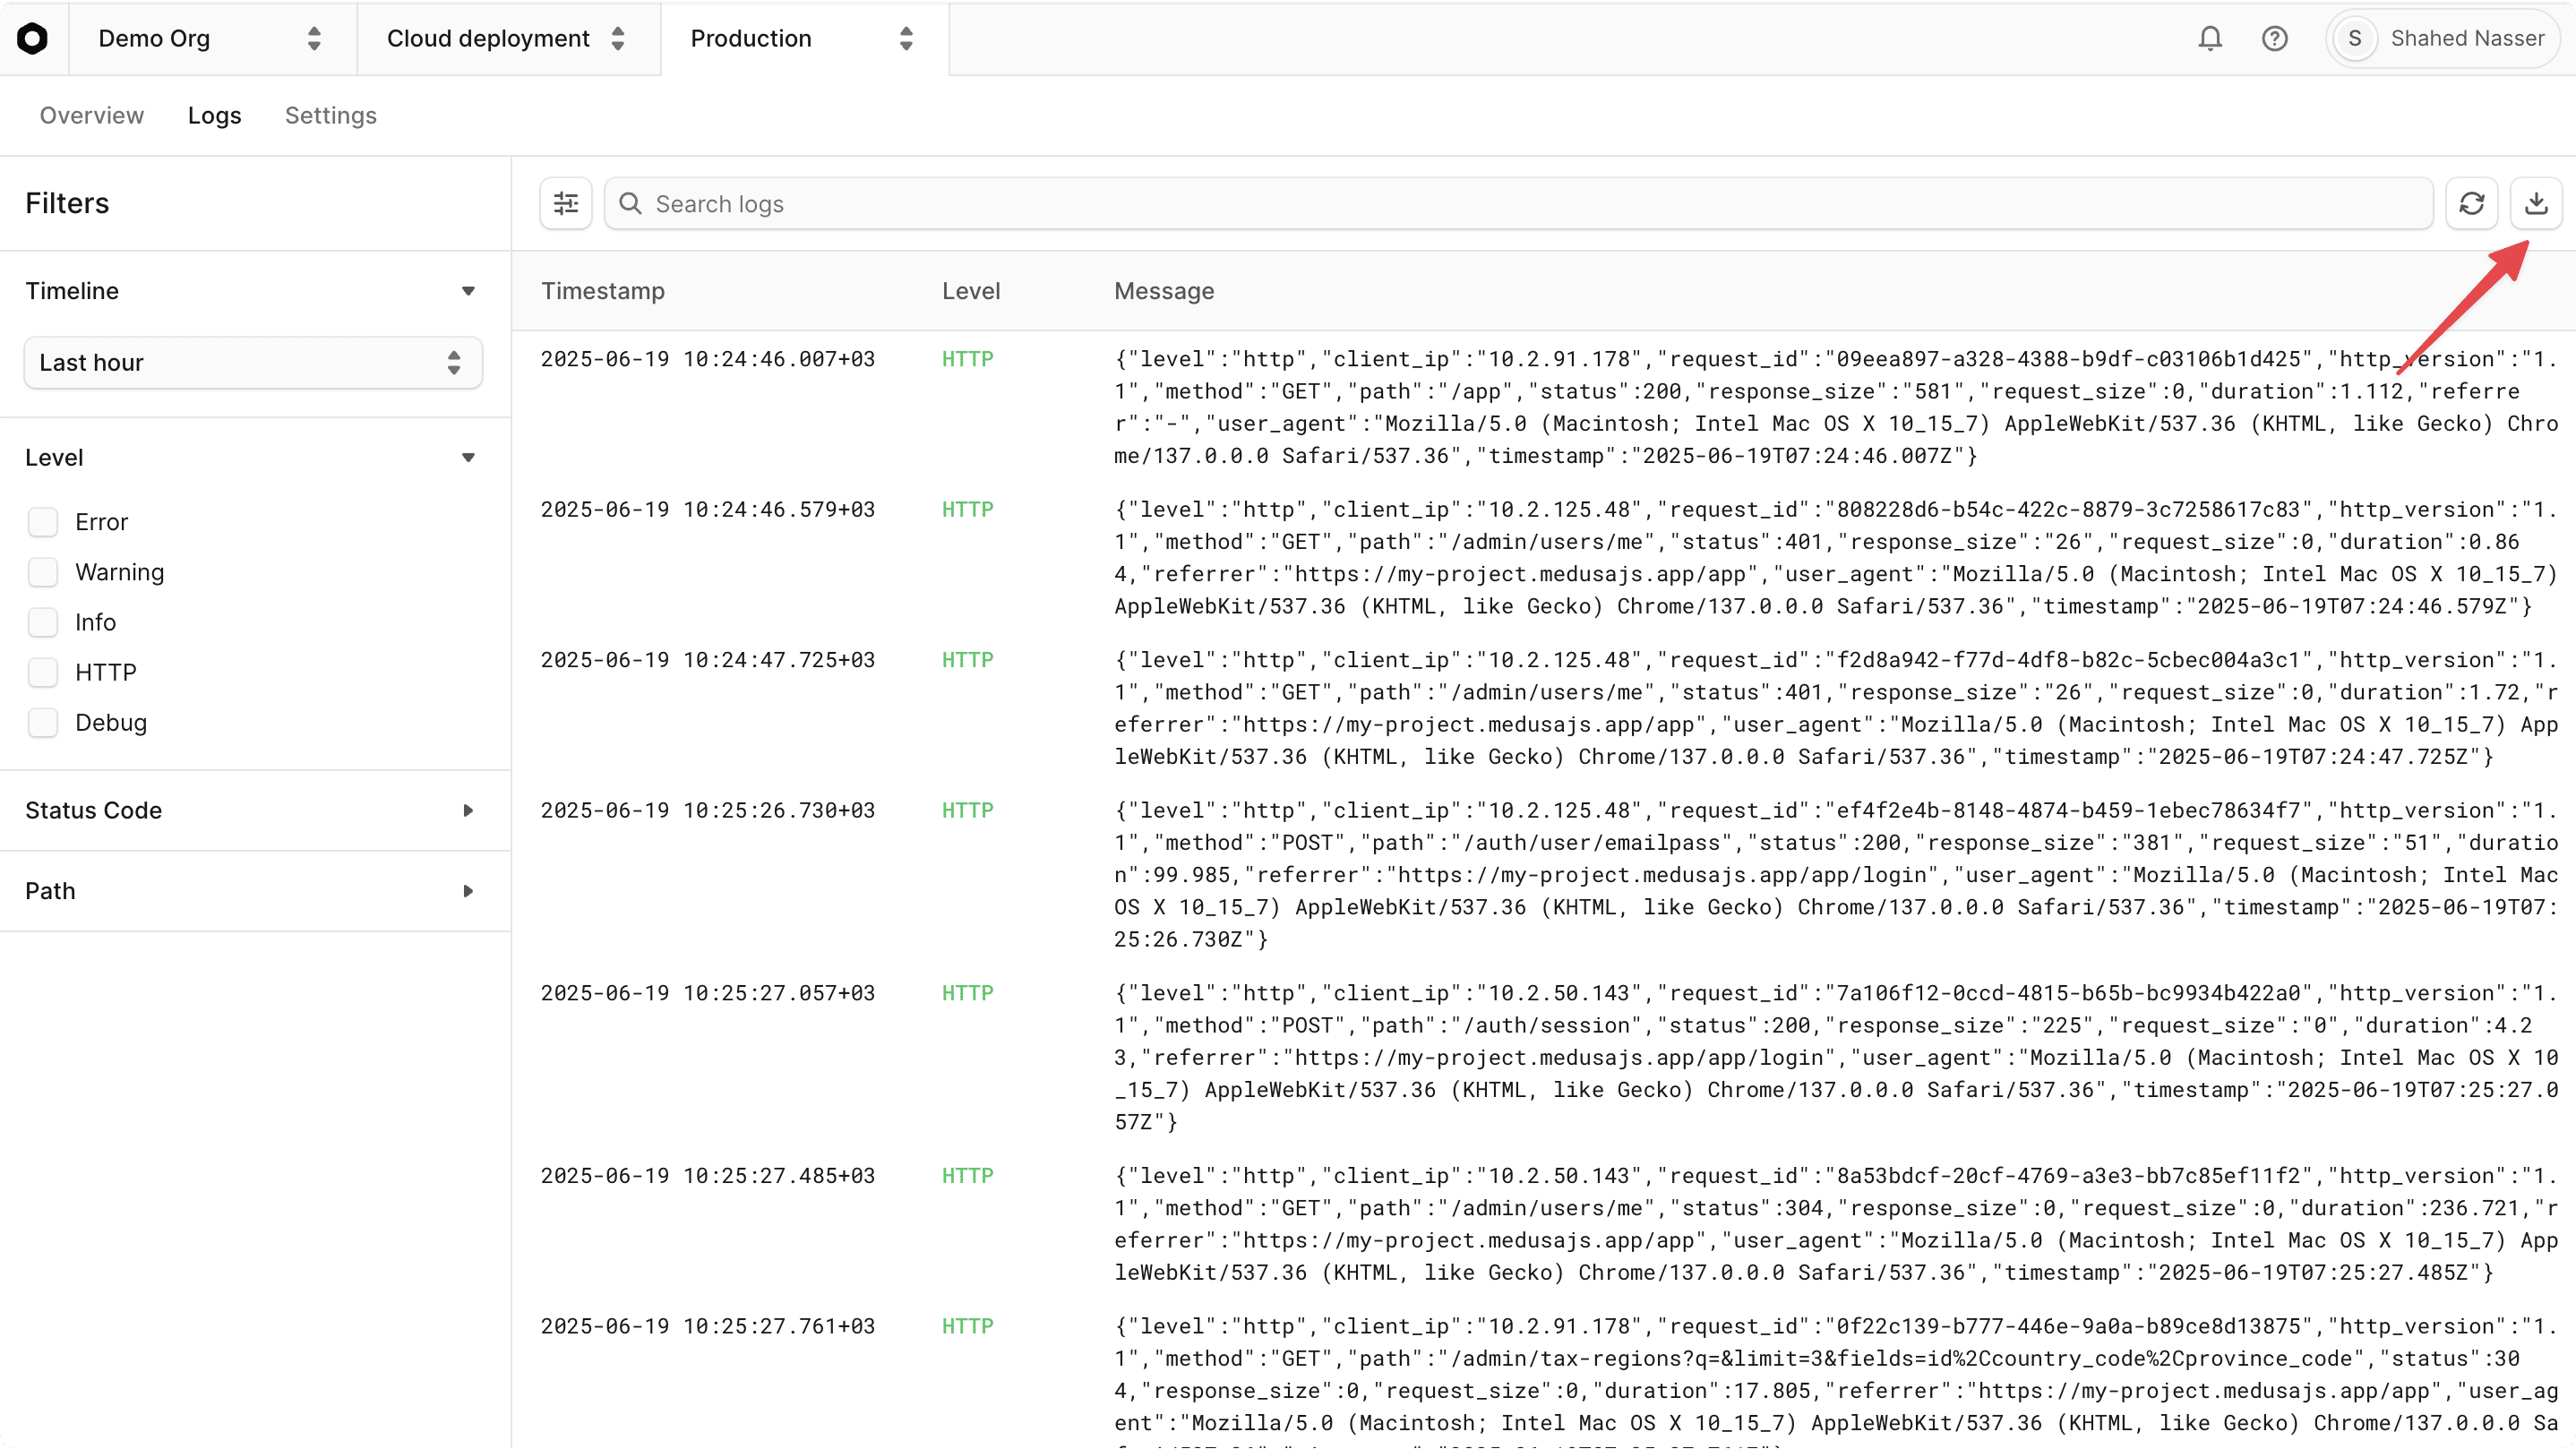
To download build logs, click the button at the top right of the logs. This will download the logs in a .log file format, which you can open with any text editor.
View Runtime Logs on Cloud#
Runtime logs are useful for debugging the live deployment of an environment's backend and storefront, especially when the deployment's status is "Deploy failed". They include logs for:
- Errors that occur during backend or storefront startup.
- Errors that occur when handling incoming HTTP requests in the backend, such as 404 errors or 500 server errors.
- Scheduled jobs, subscribers, and background workflow executions not working as expected (if they log informational or error messages).
- Other runtime issues that may occur while the backend or storefront are running.
You can only view the runtime logs of an environment's live deployment, as older deployments are no longer running and do not produce runtime logs.
To view the runtime logs for an environment's live deployment:
You can also navigate to an environment's runtime logs from the command palette. Press ⌘ + K, select View Logs, then choose a project.
- Make sure you're viewing the correct organization's dashboard in Cloud.
- Click on the project that the environment belongs to.
- Click on the environment, such as "Production".
- Click the "Logs" tab at the top of the environment's dashboard.
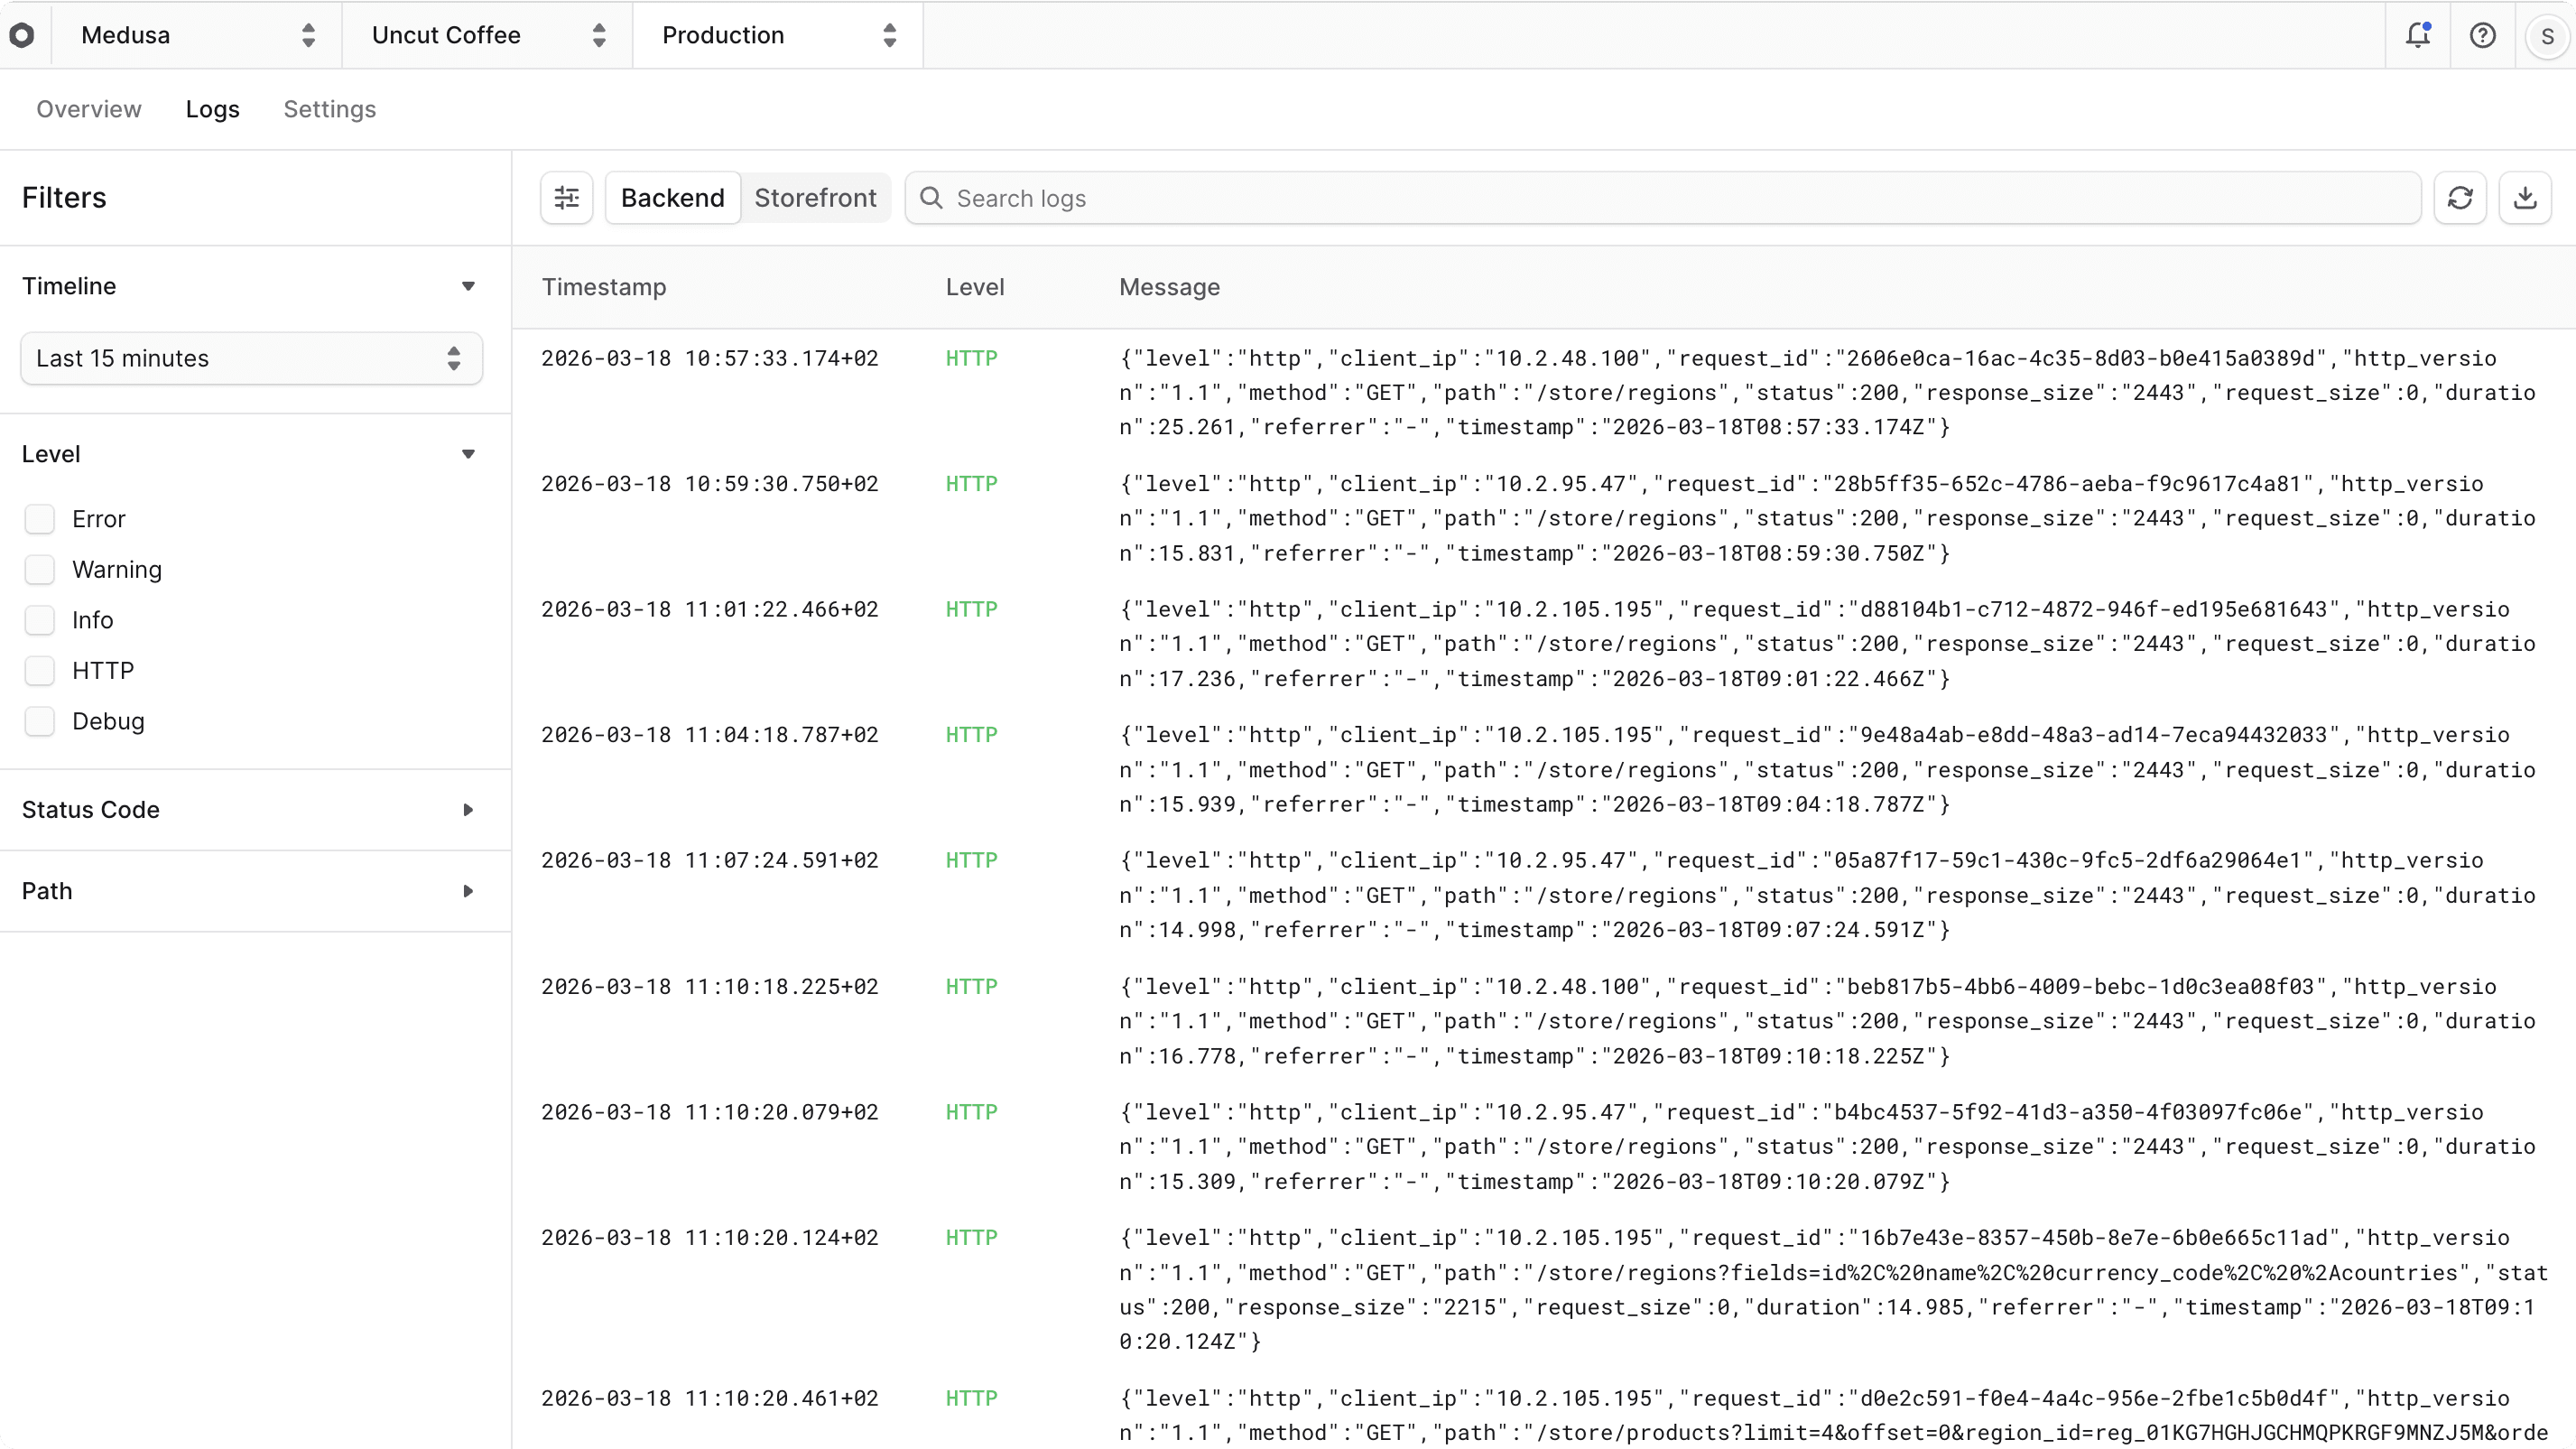
This will open the runtime logs page, where you can see the logs for the live deployment of the environment.
Switch Between Backend and Storefront Runtime Logs#
The runtime logs page shows logs for both the Medusa backend and, if you deployed a storefront alongside the Medusa application, the storefront. You can switch between the two using the toggle at the top of the logs table:
- Backend: Logs from the Medusa backend application, such as HTTP requests, errors, and startup messages.
- Storefront: Logs from the storefront application. This option is only available if you deployed a storefront alongside the Medusa application.

Search Runtime Logs#
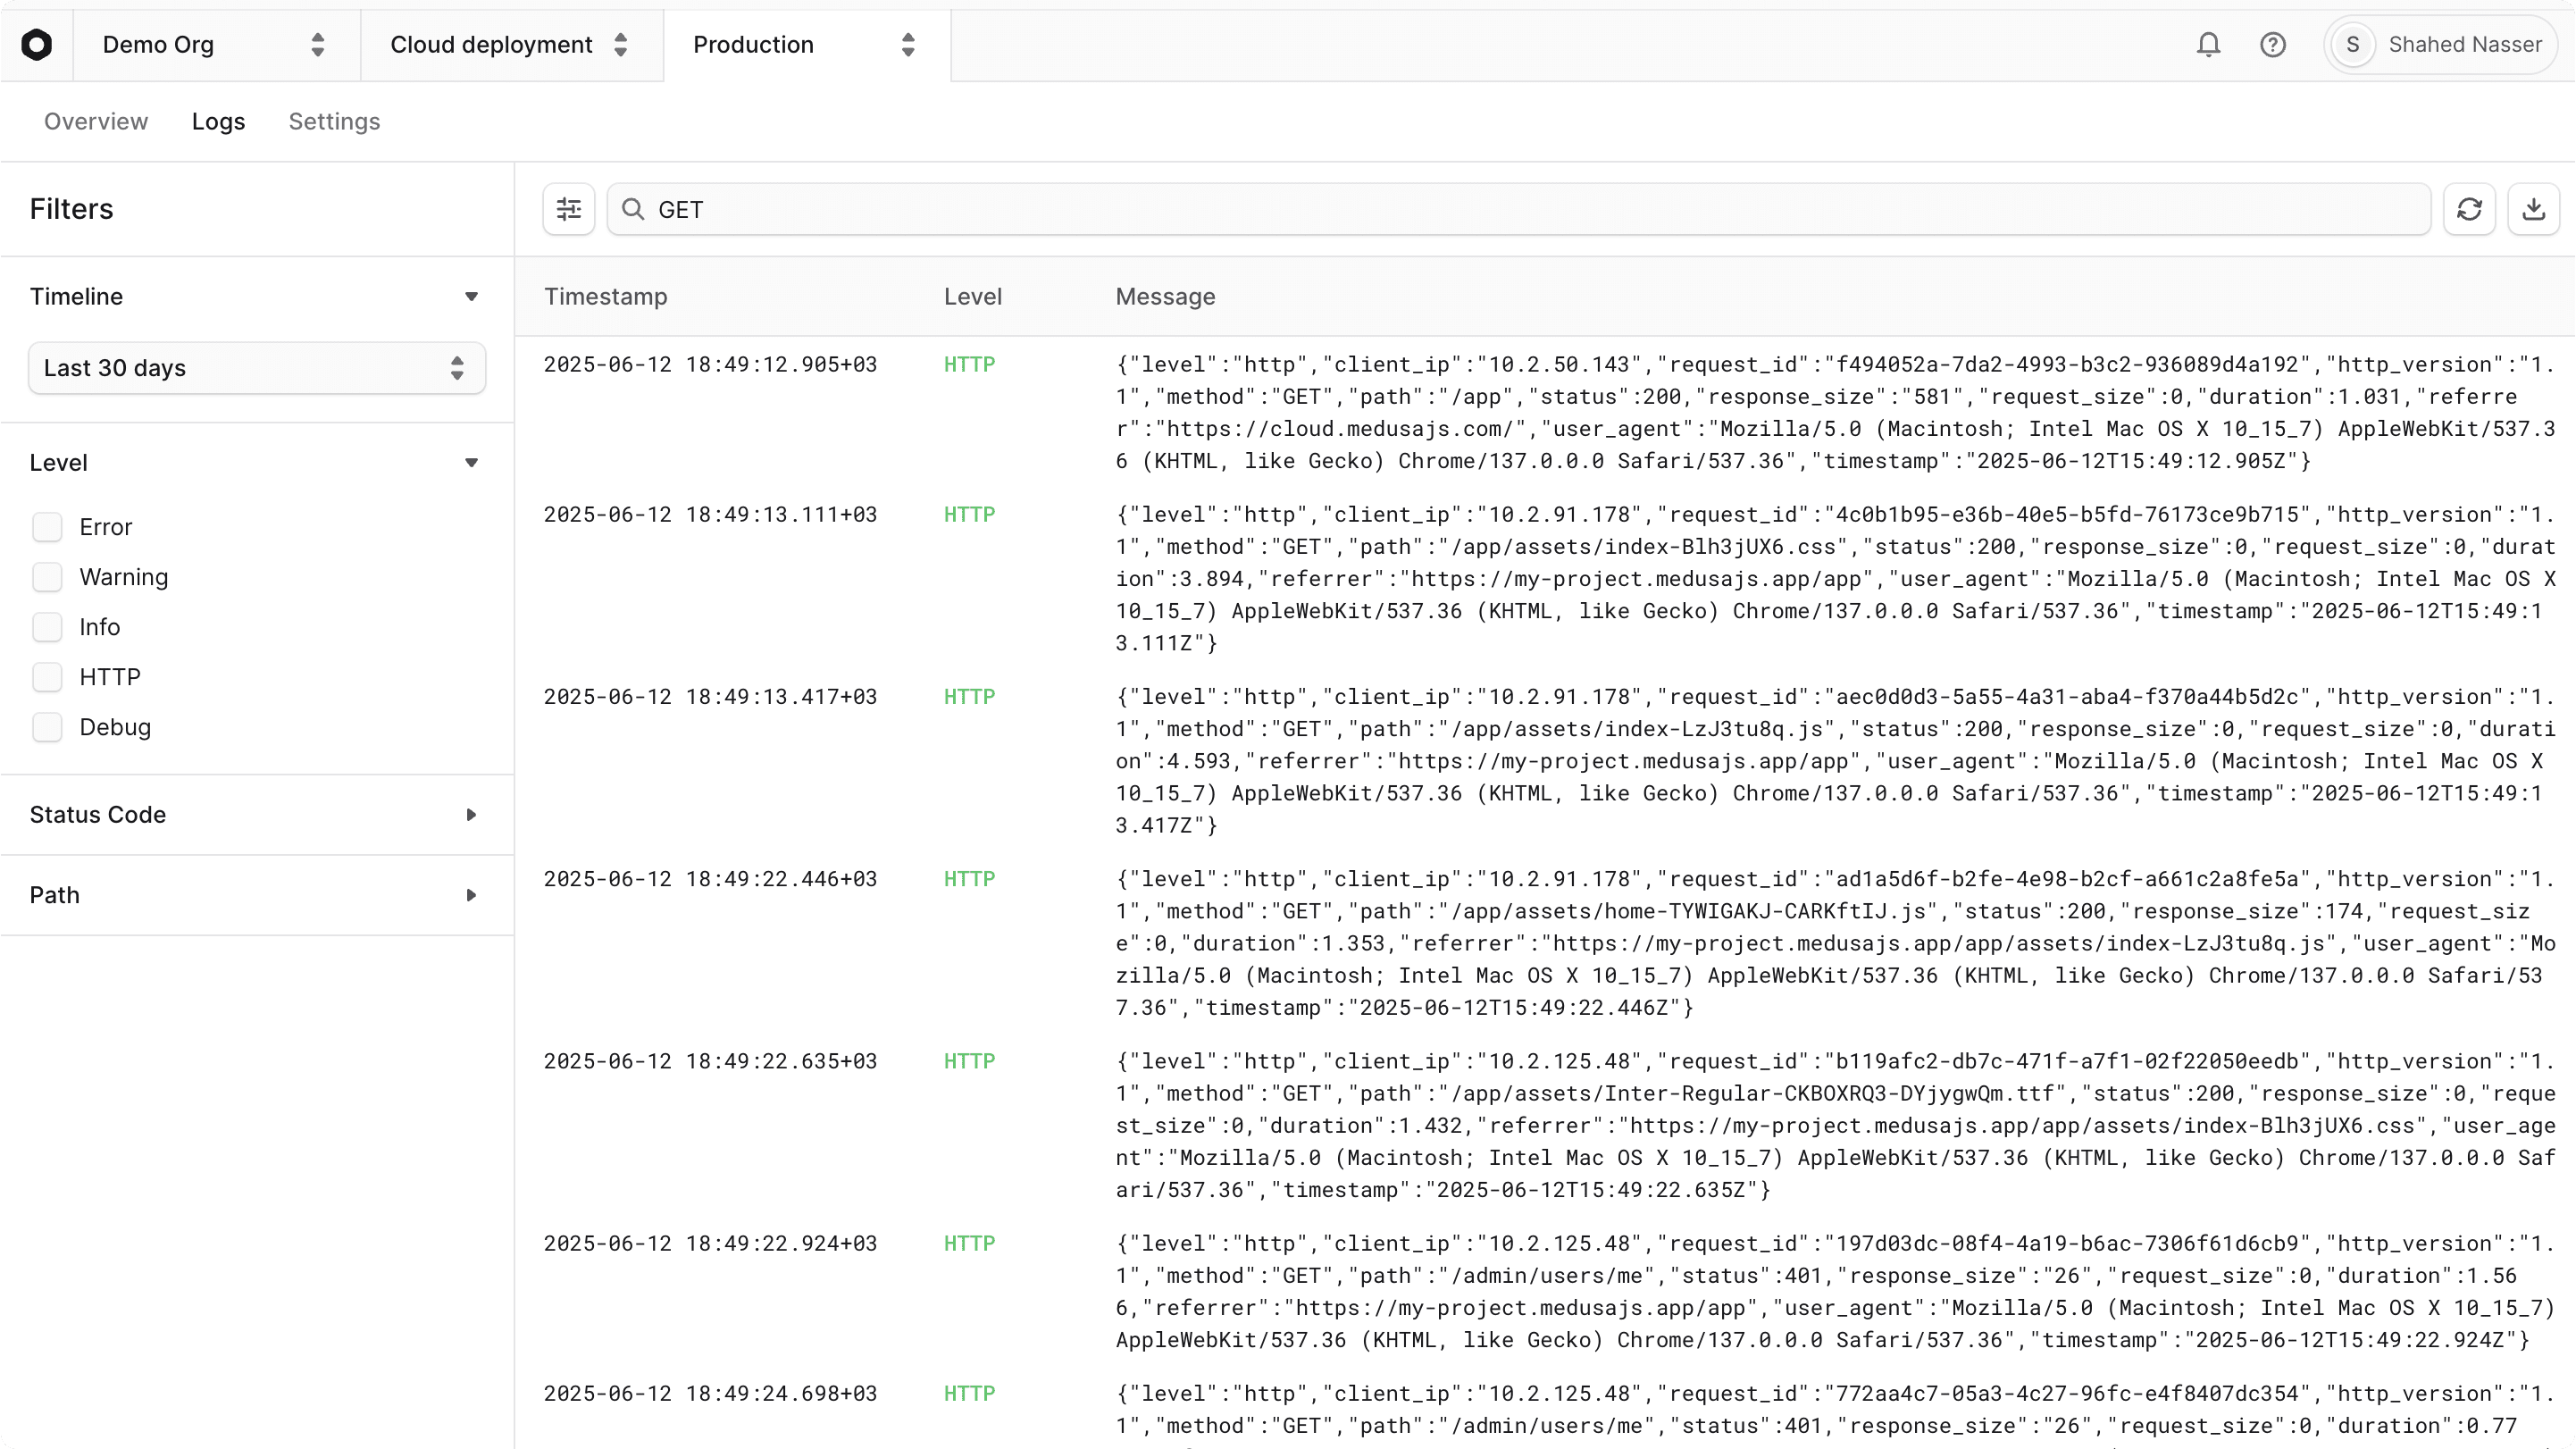
You can search the runtime logs using the search bar at the top of the Logs page. This is useful for finding specific messages or errors in the logs.
For example, you can search for keywords like "error" or an informational message that you log in your customizations to quickly locate issues in the runtime logs.
When you enter the search term, you'll only see the logs that match your search.
Filter Runtime Logs#
The Filters sidebar of the Logs page allows you to filter the runtime logs based on various criteria.
You can filter the runtime logs by:
- Timeline: Select a specific time range to view logs from that period. For example, you can view the logs from the last hour. You can also select a custom time range.
- Level: Filter logs by their severity level, such as "Info", "Warning", "Error", "Debug", or "HTTP". This helps you focus on specific types of logs that are relevant to your debugging needs.
- Status Code: Filter logs by HTTP status codes, such as "200" or "500". This is useful to find problematic API routes and resolve their errors.
- Path: Filter logs by an HTTP request path, such as
/admin/products. This is useful to find logs related to specific API routes.
Apply filters from the "Filters" sidebar. You can select multiple filters at once to narrow down the logs further.

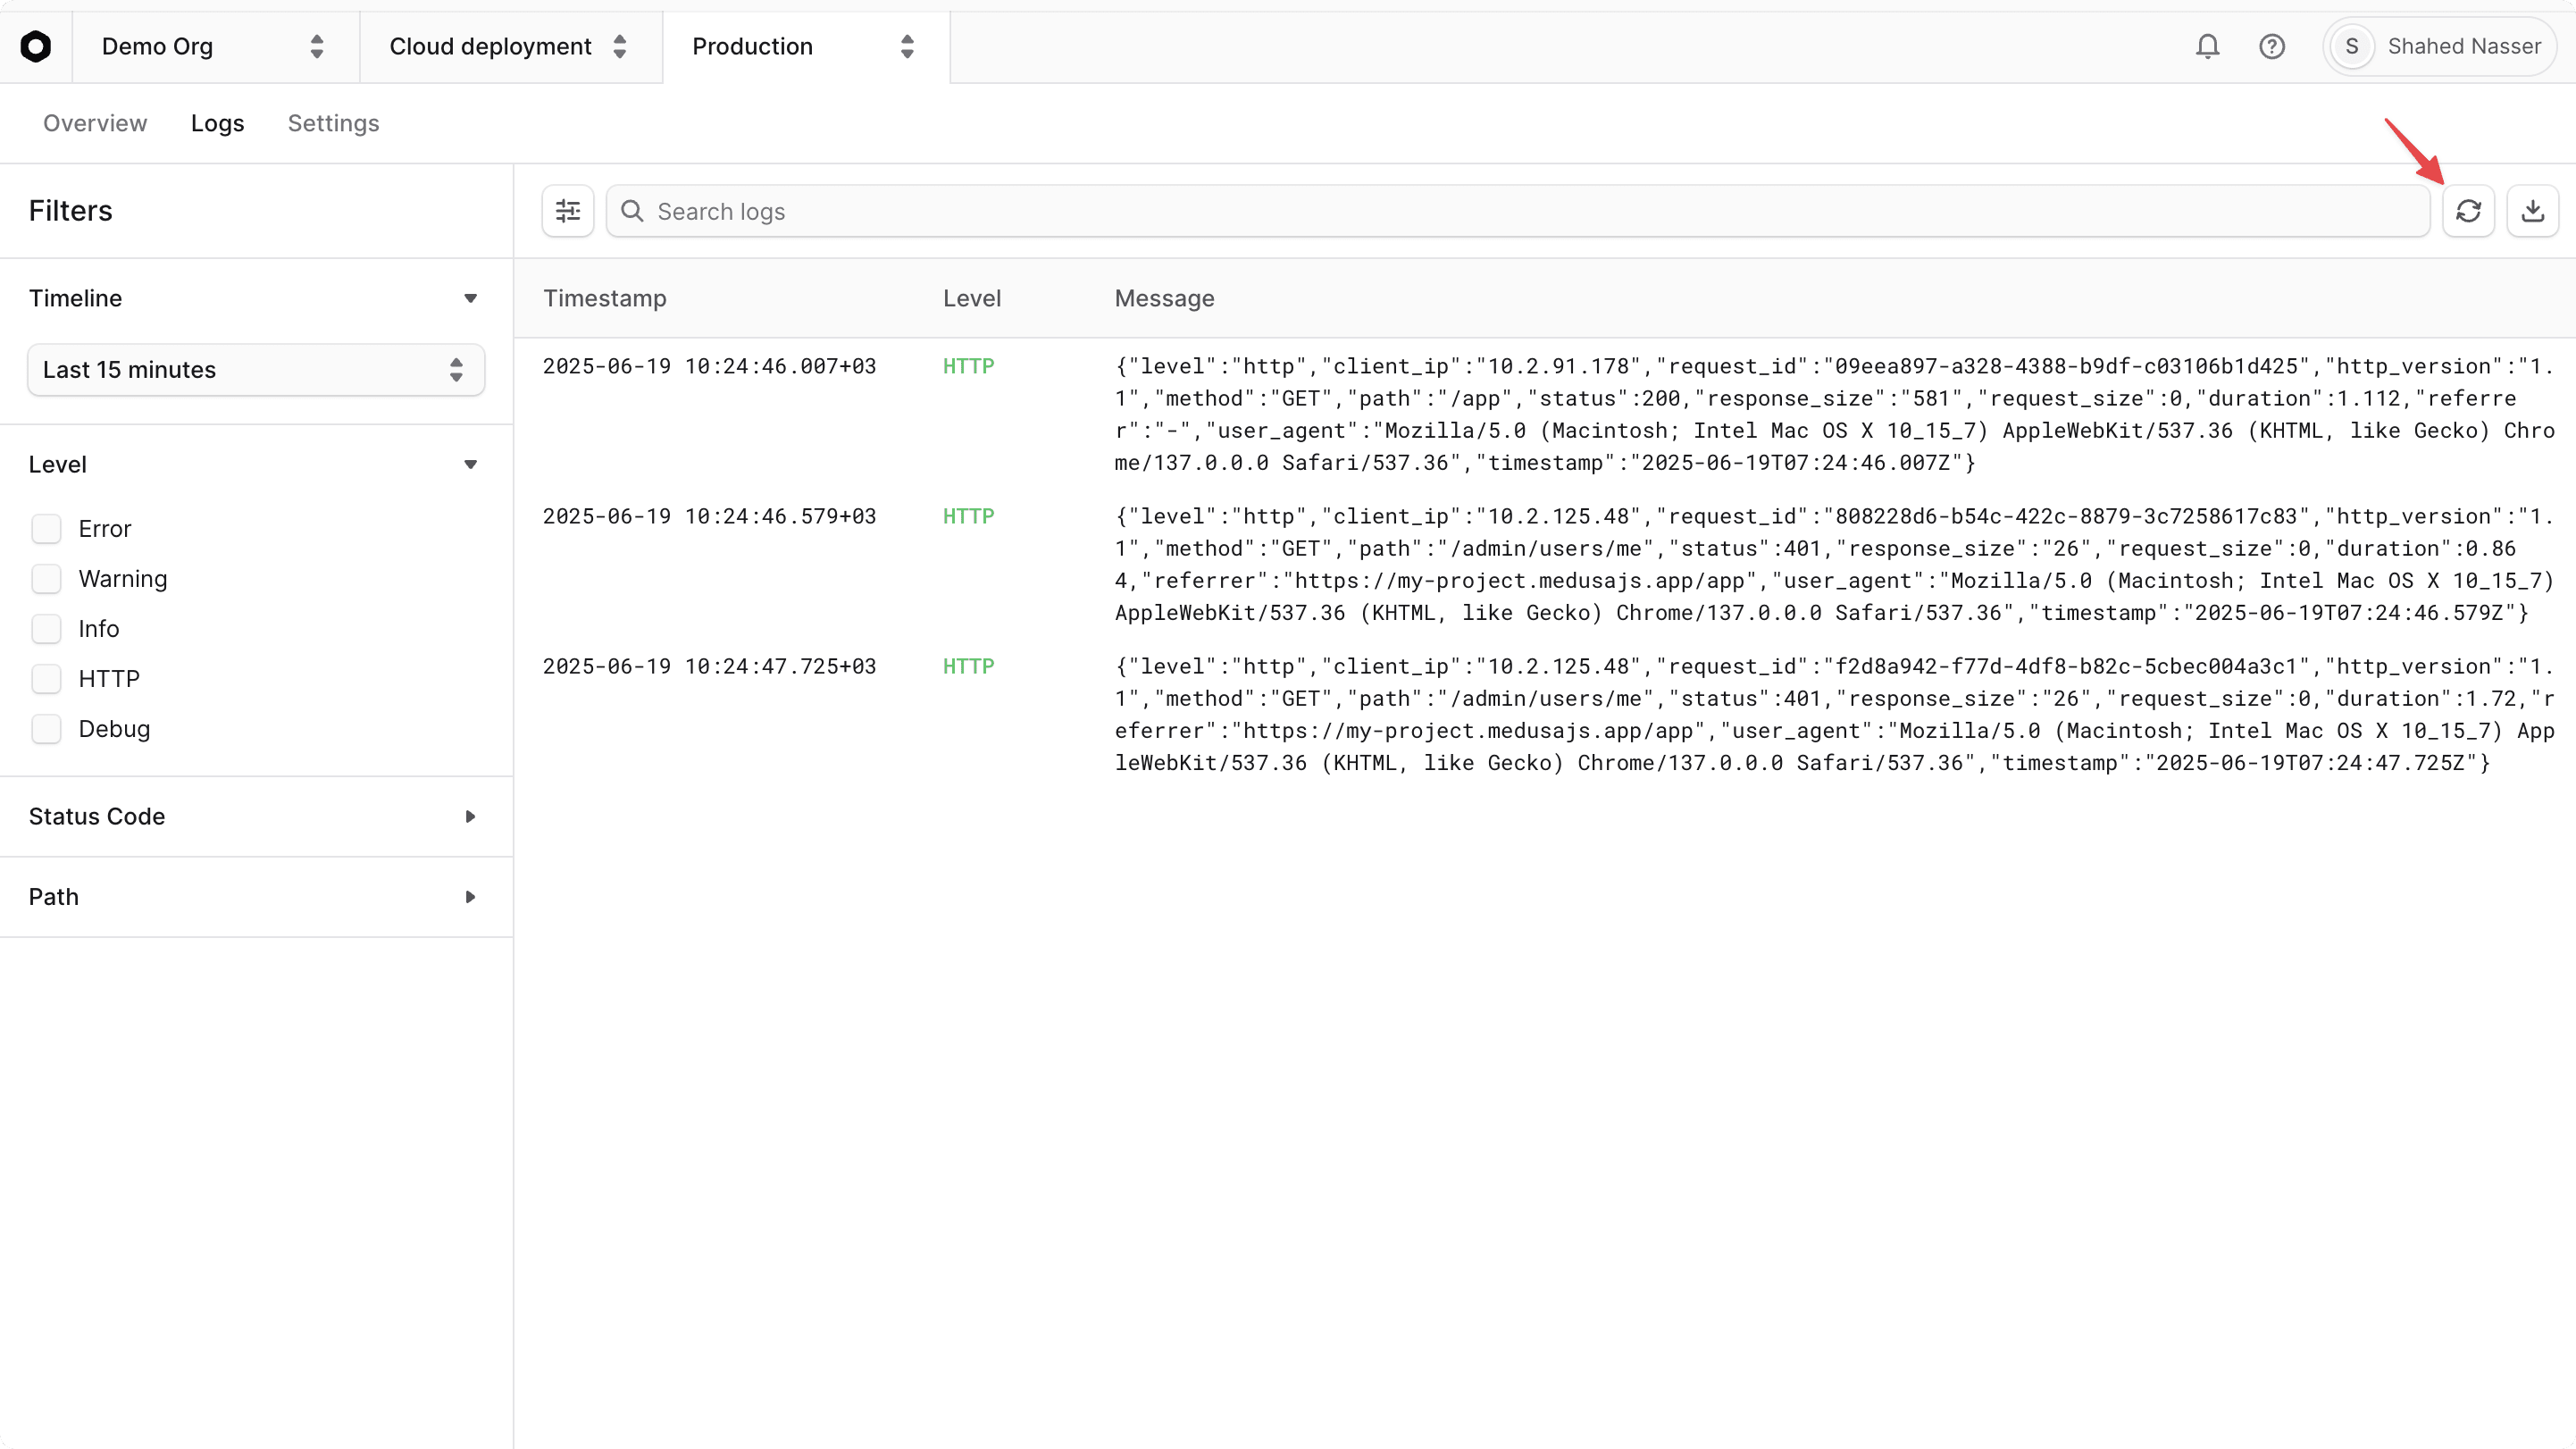
Refresh Runtime Logs#
You can refresh the runtime logs to fetch the latest logs from the live deployment or to update the view after applying filters or search terms.
To refresh the logs, click the button at the top right of the Logs page. This will fetch the latest logs from the live deployment and update the view.
View Log Details#
When you click on a runtime log message, you can view its details and metadata in a sidebar on the right side of the Logs page. This includes information like the request size, timestamp, user agent, and more.
From the log details sidebar, you can also:
- Copy the log message to your clipboard by clicking the "Copy message" button at the top right of the sidebar.
- View the JSON log details by clicking the icon at the top right of the sidebar. This will open a JSON viewer where you can see the log details in a structured format.
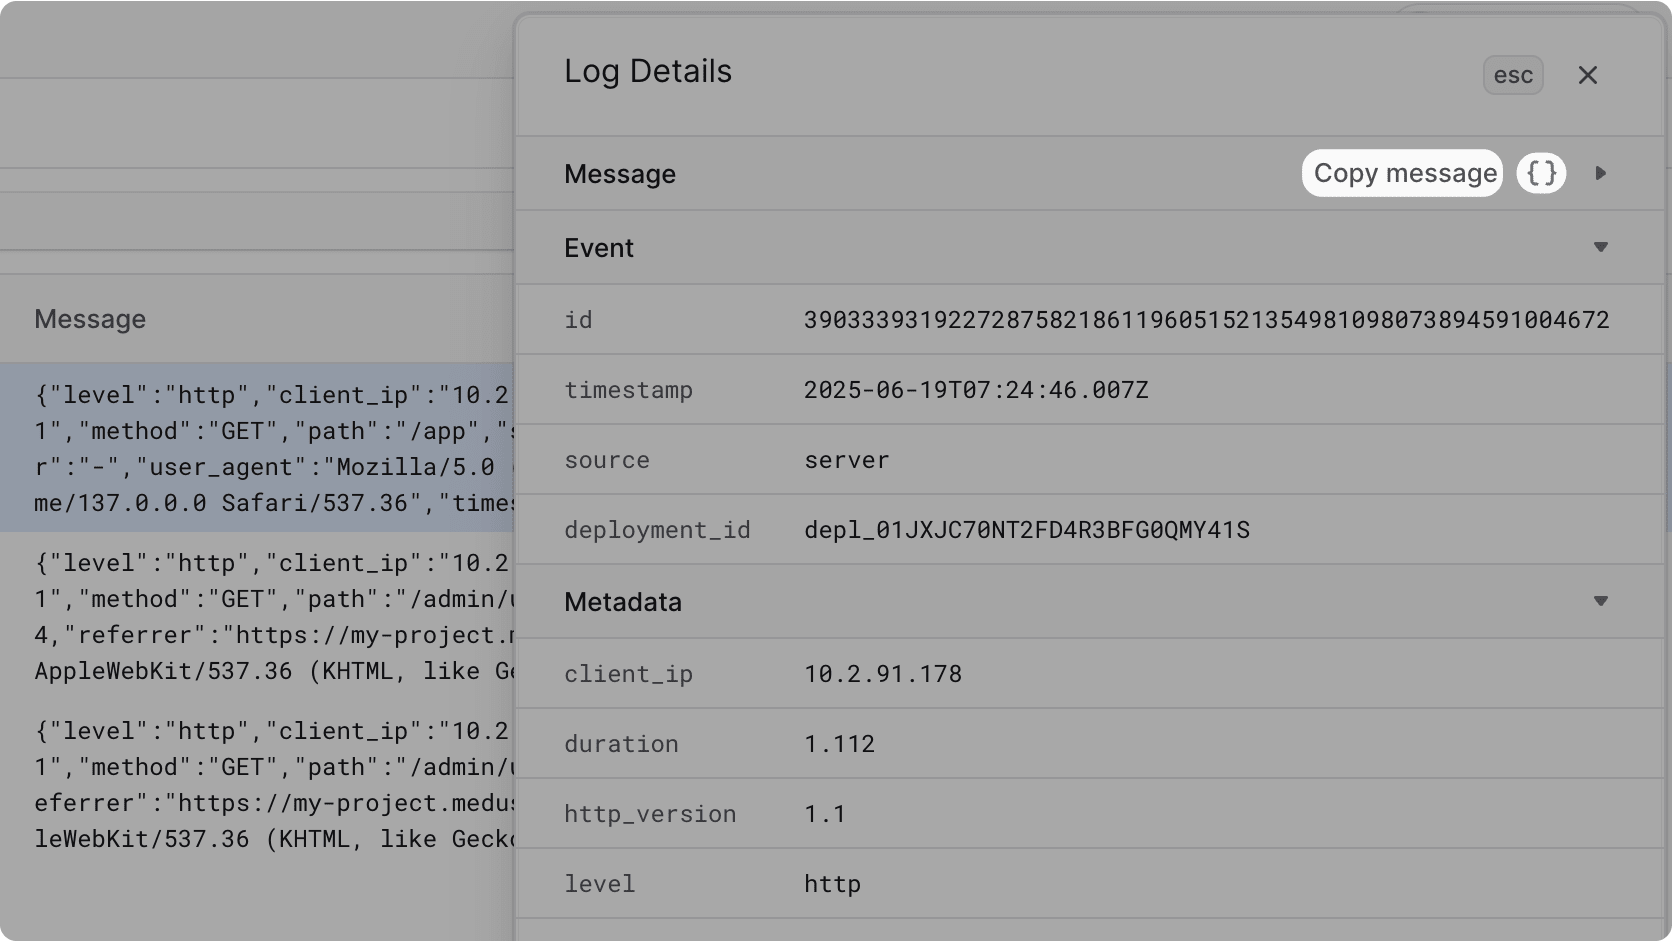
- Copy the log details in JSON format by clicking the "Copy as JSON" button at the bottom of the sidebar.

You can copy the log message or JSON details to share them with your team or the Cloud support.
Filter by Log Metadata#
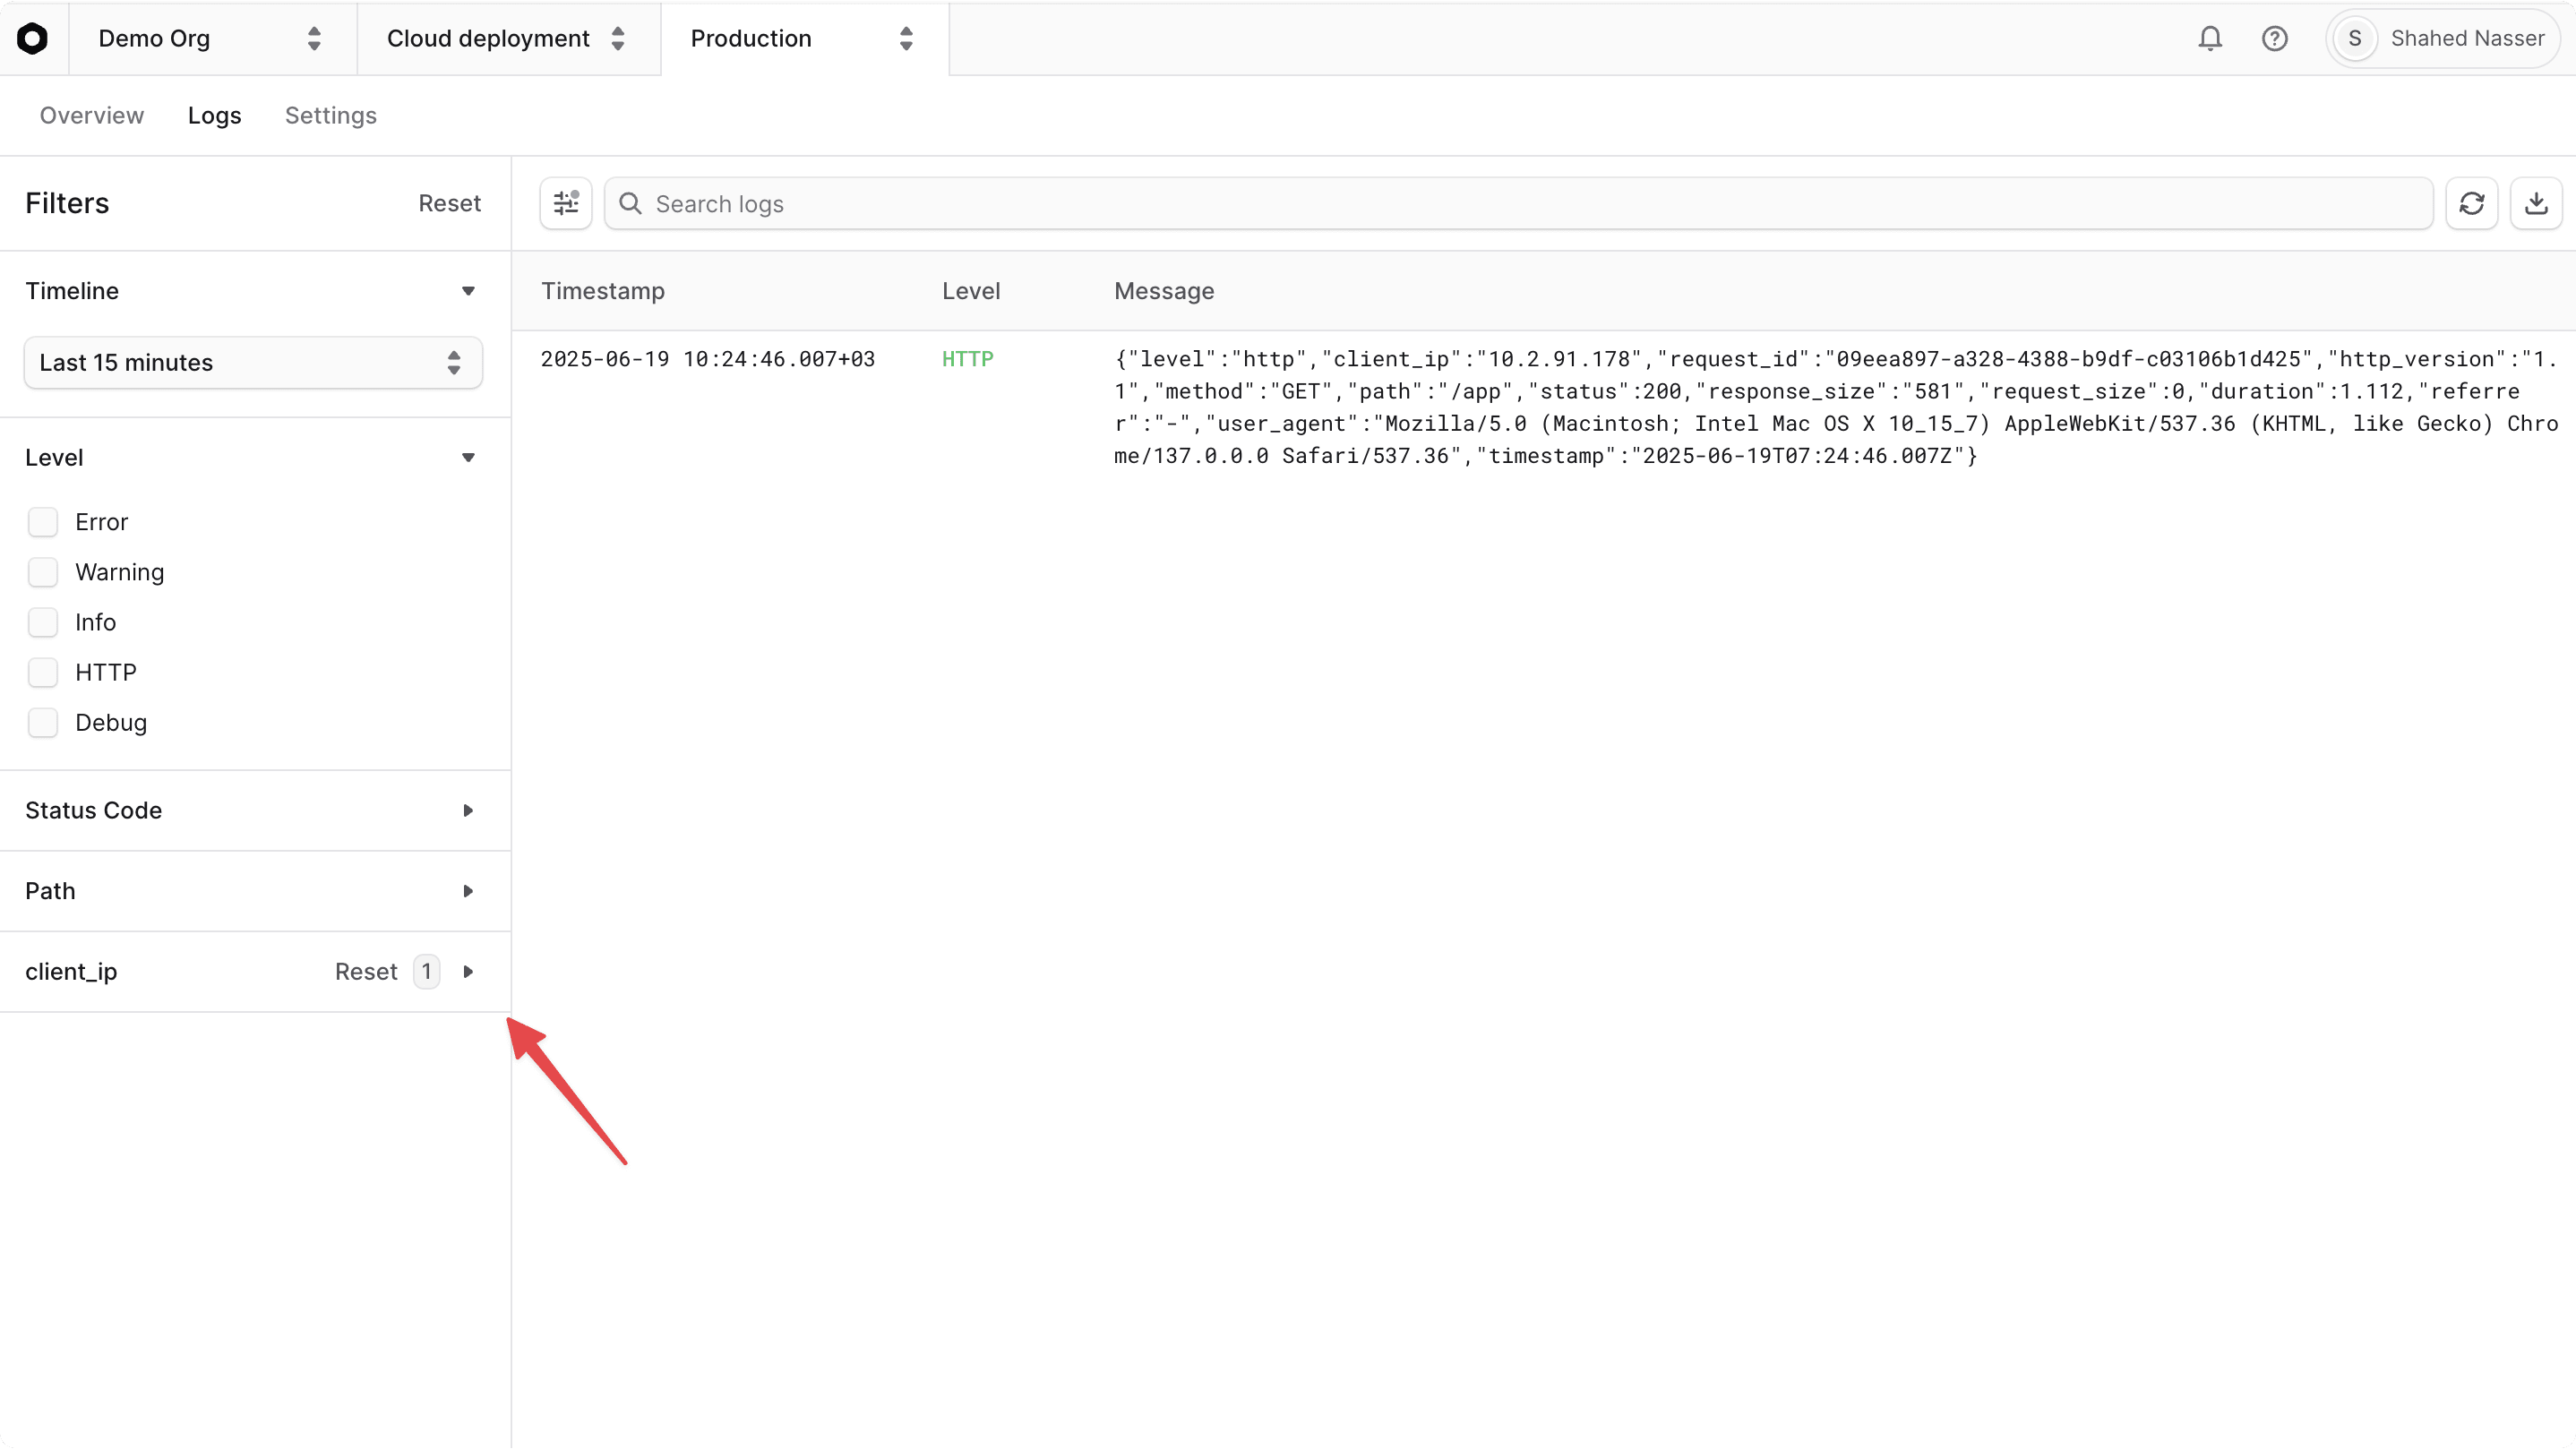
When you view a log's details, you can click on any of its metadata values to filter the logs by that value. This gives you a quick way to find all logs that share the same metadata, such as the same user agent or client IP.

When you click on a metadata value, it will be added to the Filters sidebar, and the logs will be updated by that filter.
Download Runtime Logs#
You can download the runtime logs as a .log file for offline analysis, sharing with your team, or sharing with Cloud support if you need help debugging an issue.
To download runtime logs, click the button at the top right of the Logs page. This will download the logs currently shown in a .json file format, which you can open with any text editor.
