Deployments
In this guide, you'll learn about deployments in Cloud, how they're created, and how you can troubleshoot them.
Deployments Overview#
Each environment has at least one deployment, which is publicly accessible at the environment's URL.
A deployment is created from the latest source code of an environment's branch. An environment can have only one live deployment at a time.
The latest deployment of an environment is the live version of that environment, unless you redeploy a previous deployment.
If you deployed both the Medusa backend and storefront in an environment, each deployment refers to the backend and storefront. The deployment will also show the status of both the backend and storefront.
How are Deployments Created?#
For long-lived environments, Medusa creates a new deployment every time you push a new commit to the environment's branch. For example, if your Production environment is connected to the main branch, Medusa will create a new Production deployment every time you push a new commit to the main branch.
For short-lived preview environments, Medusa creates a new environment and deployment when you open a pull request. Medusa will redeploy the preview environment every time you push a new commit to the pull request branch.
Build Process for Deployments#
Medusa Application Only#
Before deploying your application on Cloud, Medusa runs the build script defined in your project's package.json file, which must run the medusa build command, among other build steps you may have.
For example, your build script may look like this:
npm run other-build-steps with the appropriate command for your package manager, such as yarn other-build-steps.Medusa Application with Storefront#
If you're deploying both a Medusa application and a storefront on Cloud, Medusa will run the:
- The
buildcommand defined in the backend'spackage.jsonfile, which must run themedusa buildcommand. - The build command relevant to the storefront, depending on the frontend framework you're using. For example, if you're using Next.js for your storefront, Medusa will run the
next buildcommand in the storefront's directory.- Medusa currently doesn't support custom build scripts for storefronts.
What Gets Deployed in the Medusa Application?#
Medusa deploys the contents of the .medusa/server directory of the Medusa application. This directory is created by the build process. It includes the compiled JavaScript files in your project, the production build of the admin dashboard, and other necessary files to run your Medusa application in production.
So, if you have custom assets like JSON files that your application needs at runtime, make sure to copy them to the .medusa/server directory after the medusa build command in your build script.
For example, if your application needs a src/data/custom.json file at runtime, you can add a script that copies it to .medusa/server/src/data/custom.json after the build process is complete.
You can also customize the Medusa Admin build configurations using the admin.vite option in your medusa-config.ts file.
.medusa/server/public directory, as they will be publicly accessible. Sensitive files include those containing secret API keys, database credentials, or any other confidential information.Find Project Deployments#
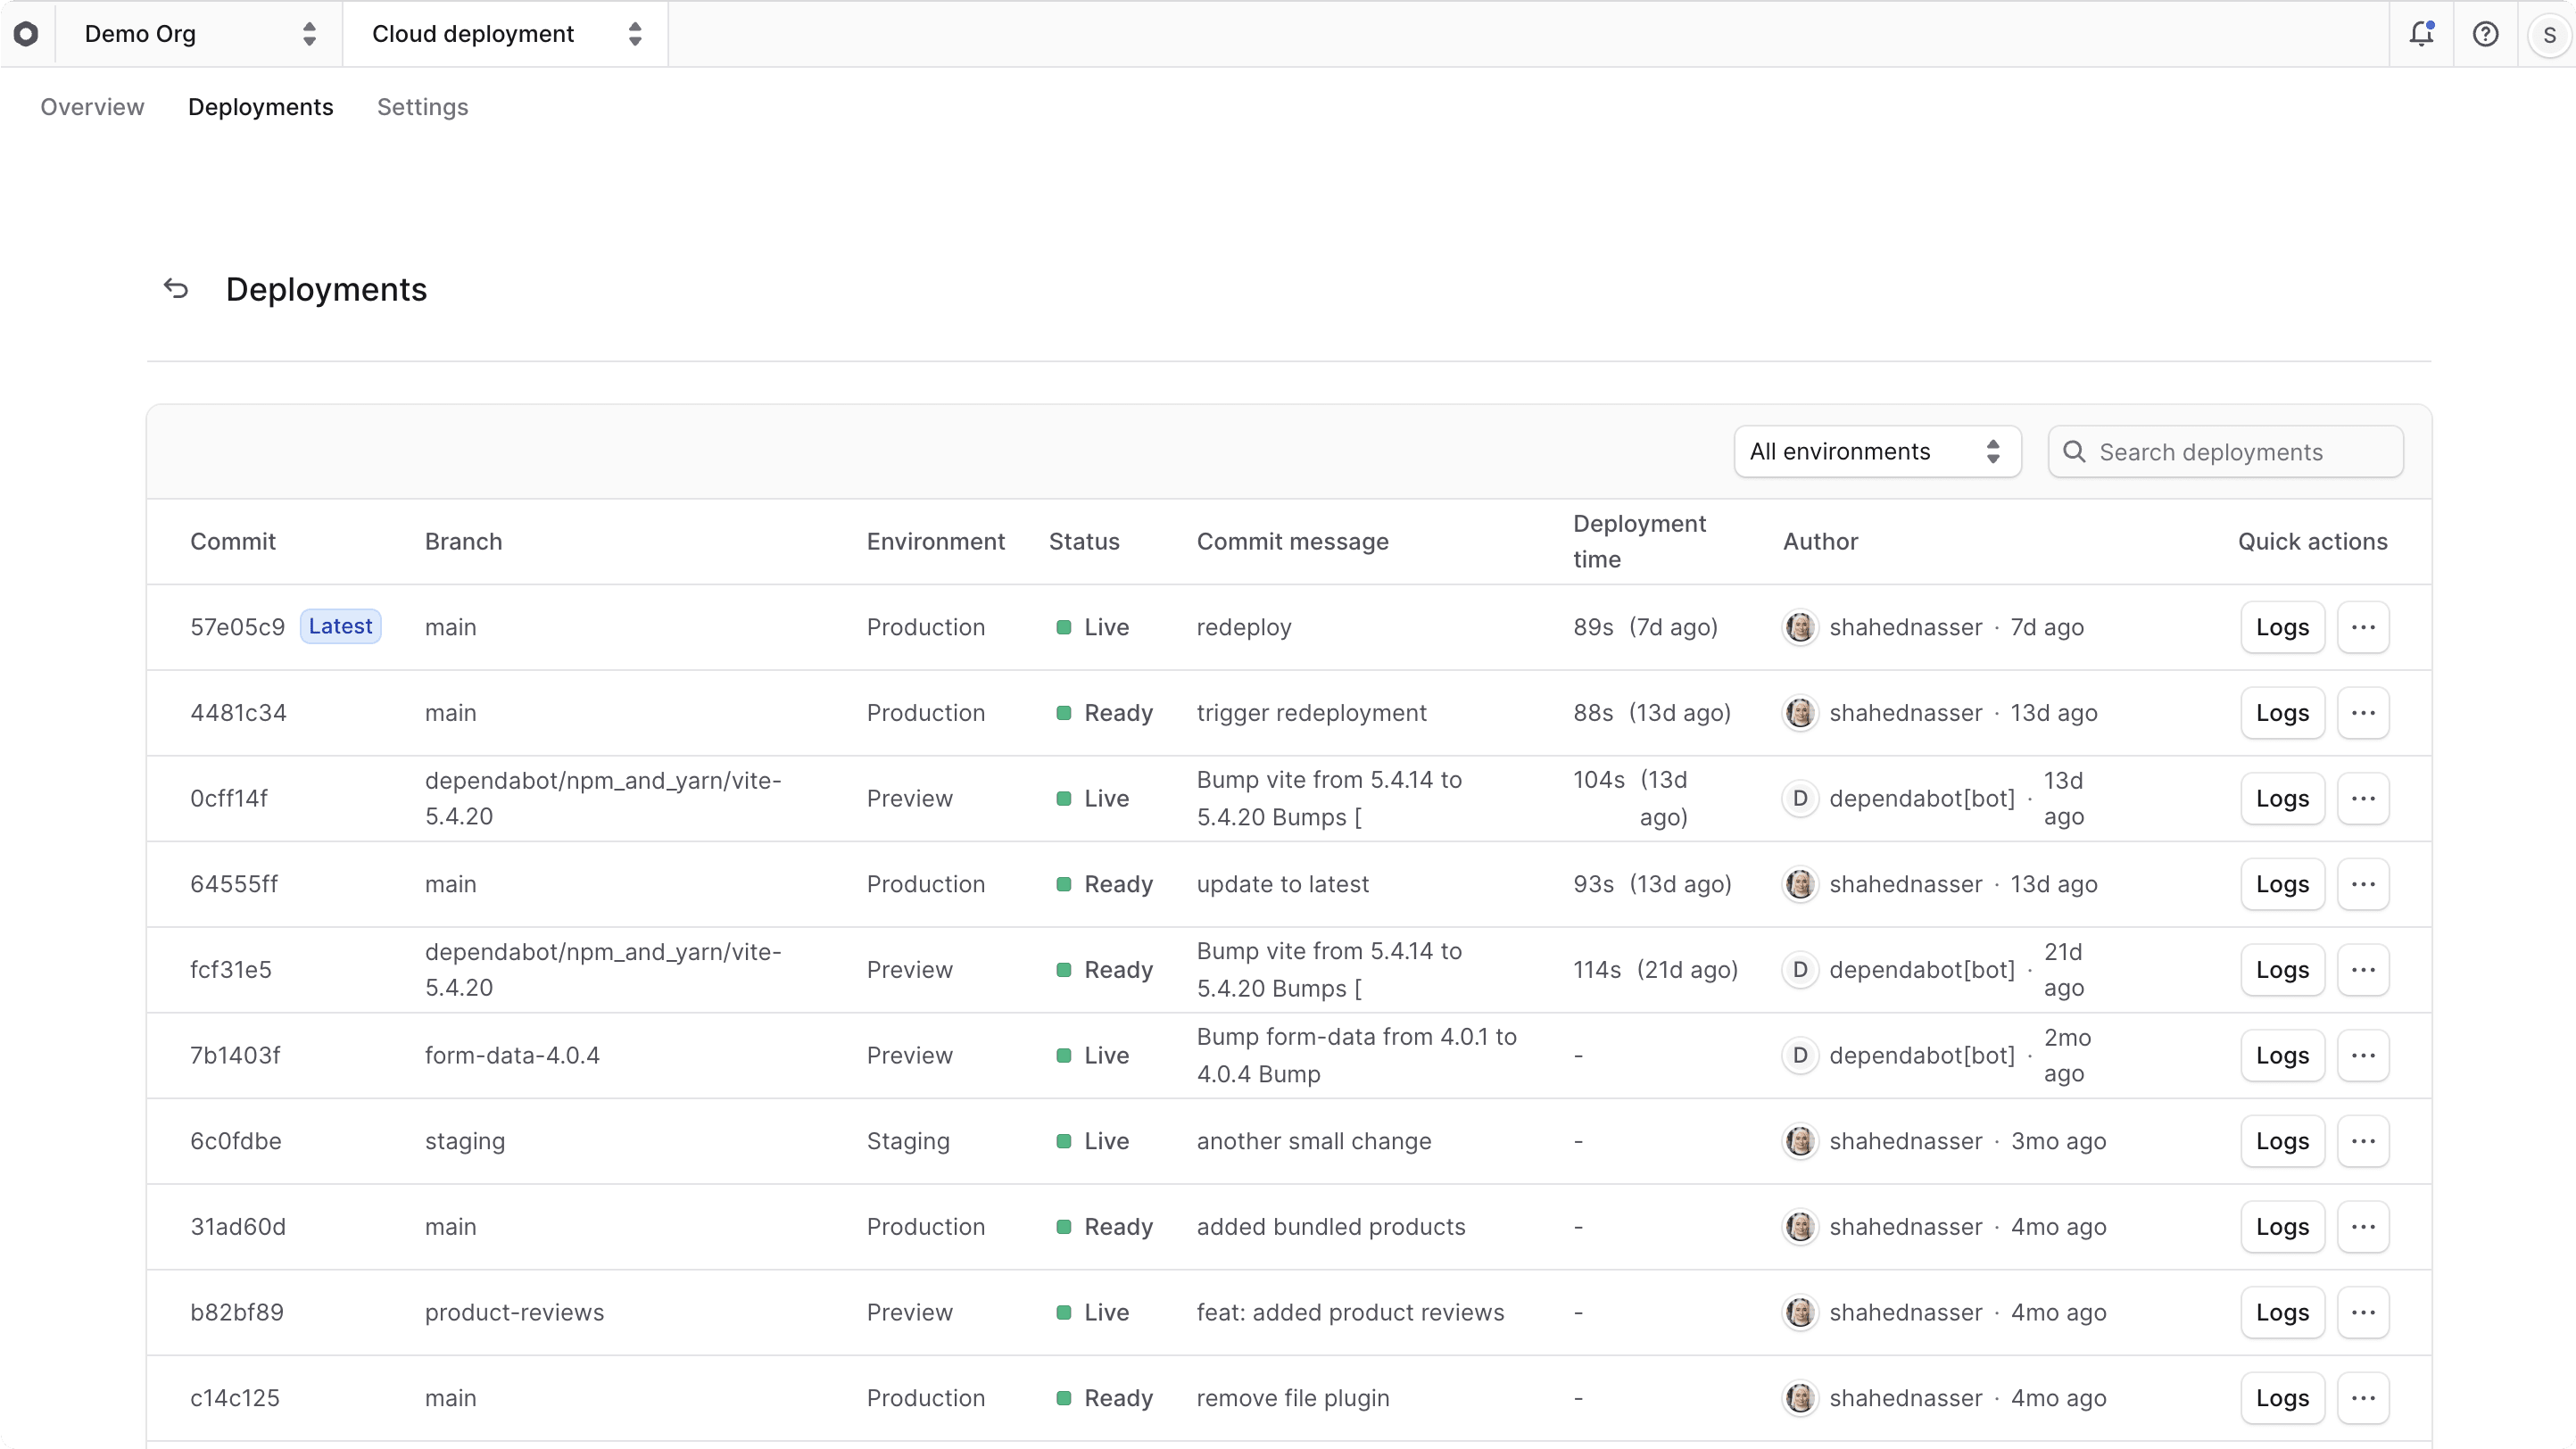
You can find the deployments for a project in its dashboard.
To find the deployments for a project:
You can also navigate to a project's deployments from the command palette. Press ⌘ + K, select Deployments, then choose a project.
- Make sure you're viewing the correct organization's dashboard in Cloud.
- Click on the project you want to view its deployments.
- Click on the "Deployments" tab in the project's dashboard.
You'll find all deployments for the project's environments in the "Deployments" tab, sorted in descending order. For each deployment, you can see its branch, environment, status, and more.
Find Environment Deployments#
You can find the deployments for an environment in the project and environment dashboards.
For example, to find the deployments for the Production environment:
- Go to its project's dashboard.
- Click on the "Production" environment card.
- You'll find the deployments in the "Deployments" table on the environment's dashboard.

Find Deployment Details#
You'll often need to check a deployment's details, such as its status, commit information, and logs.
To view a deployment's details:
- Go to its project's dashboard.
- Click on the "Deployments" tab.
- Click on the deployment in the deployments table.
This will open the deployment's details page, where you can also see the deployment's commit at the top of the page.
On the deployment details page, you'll find:
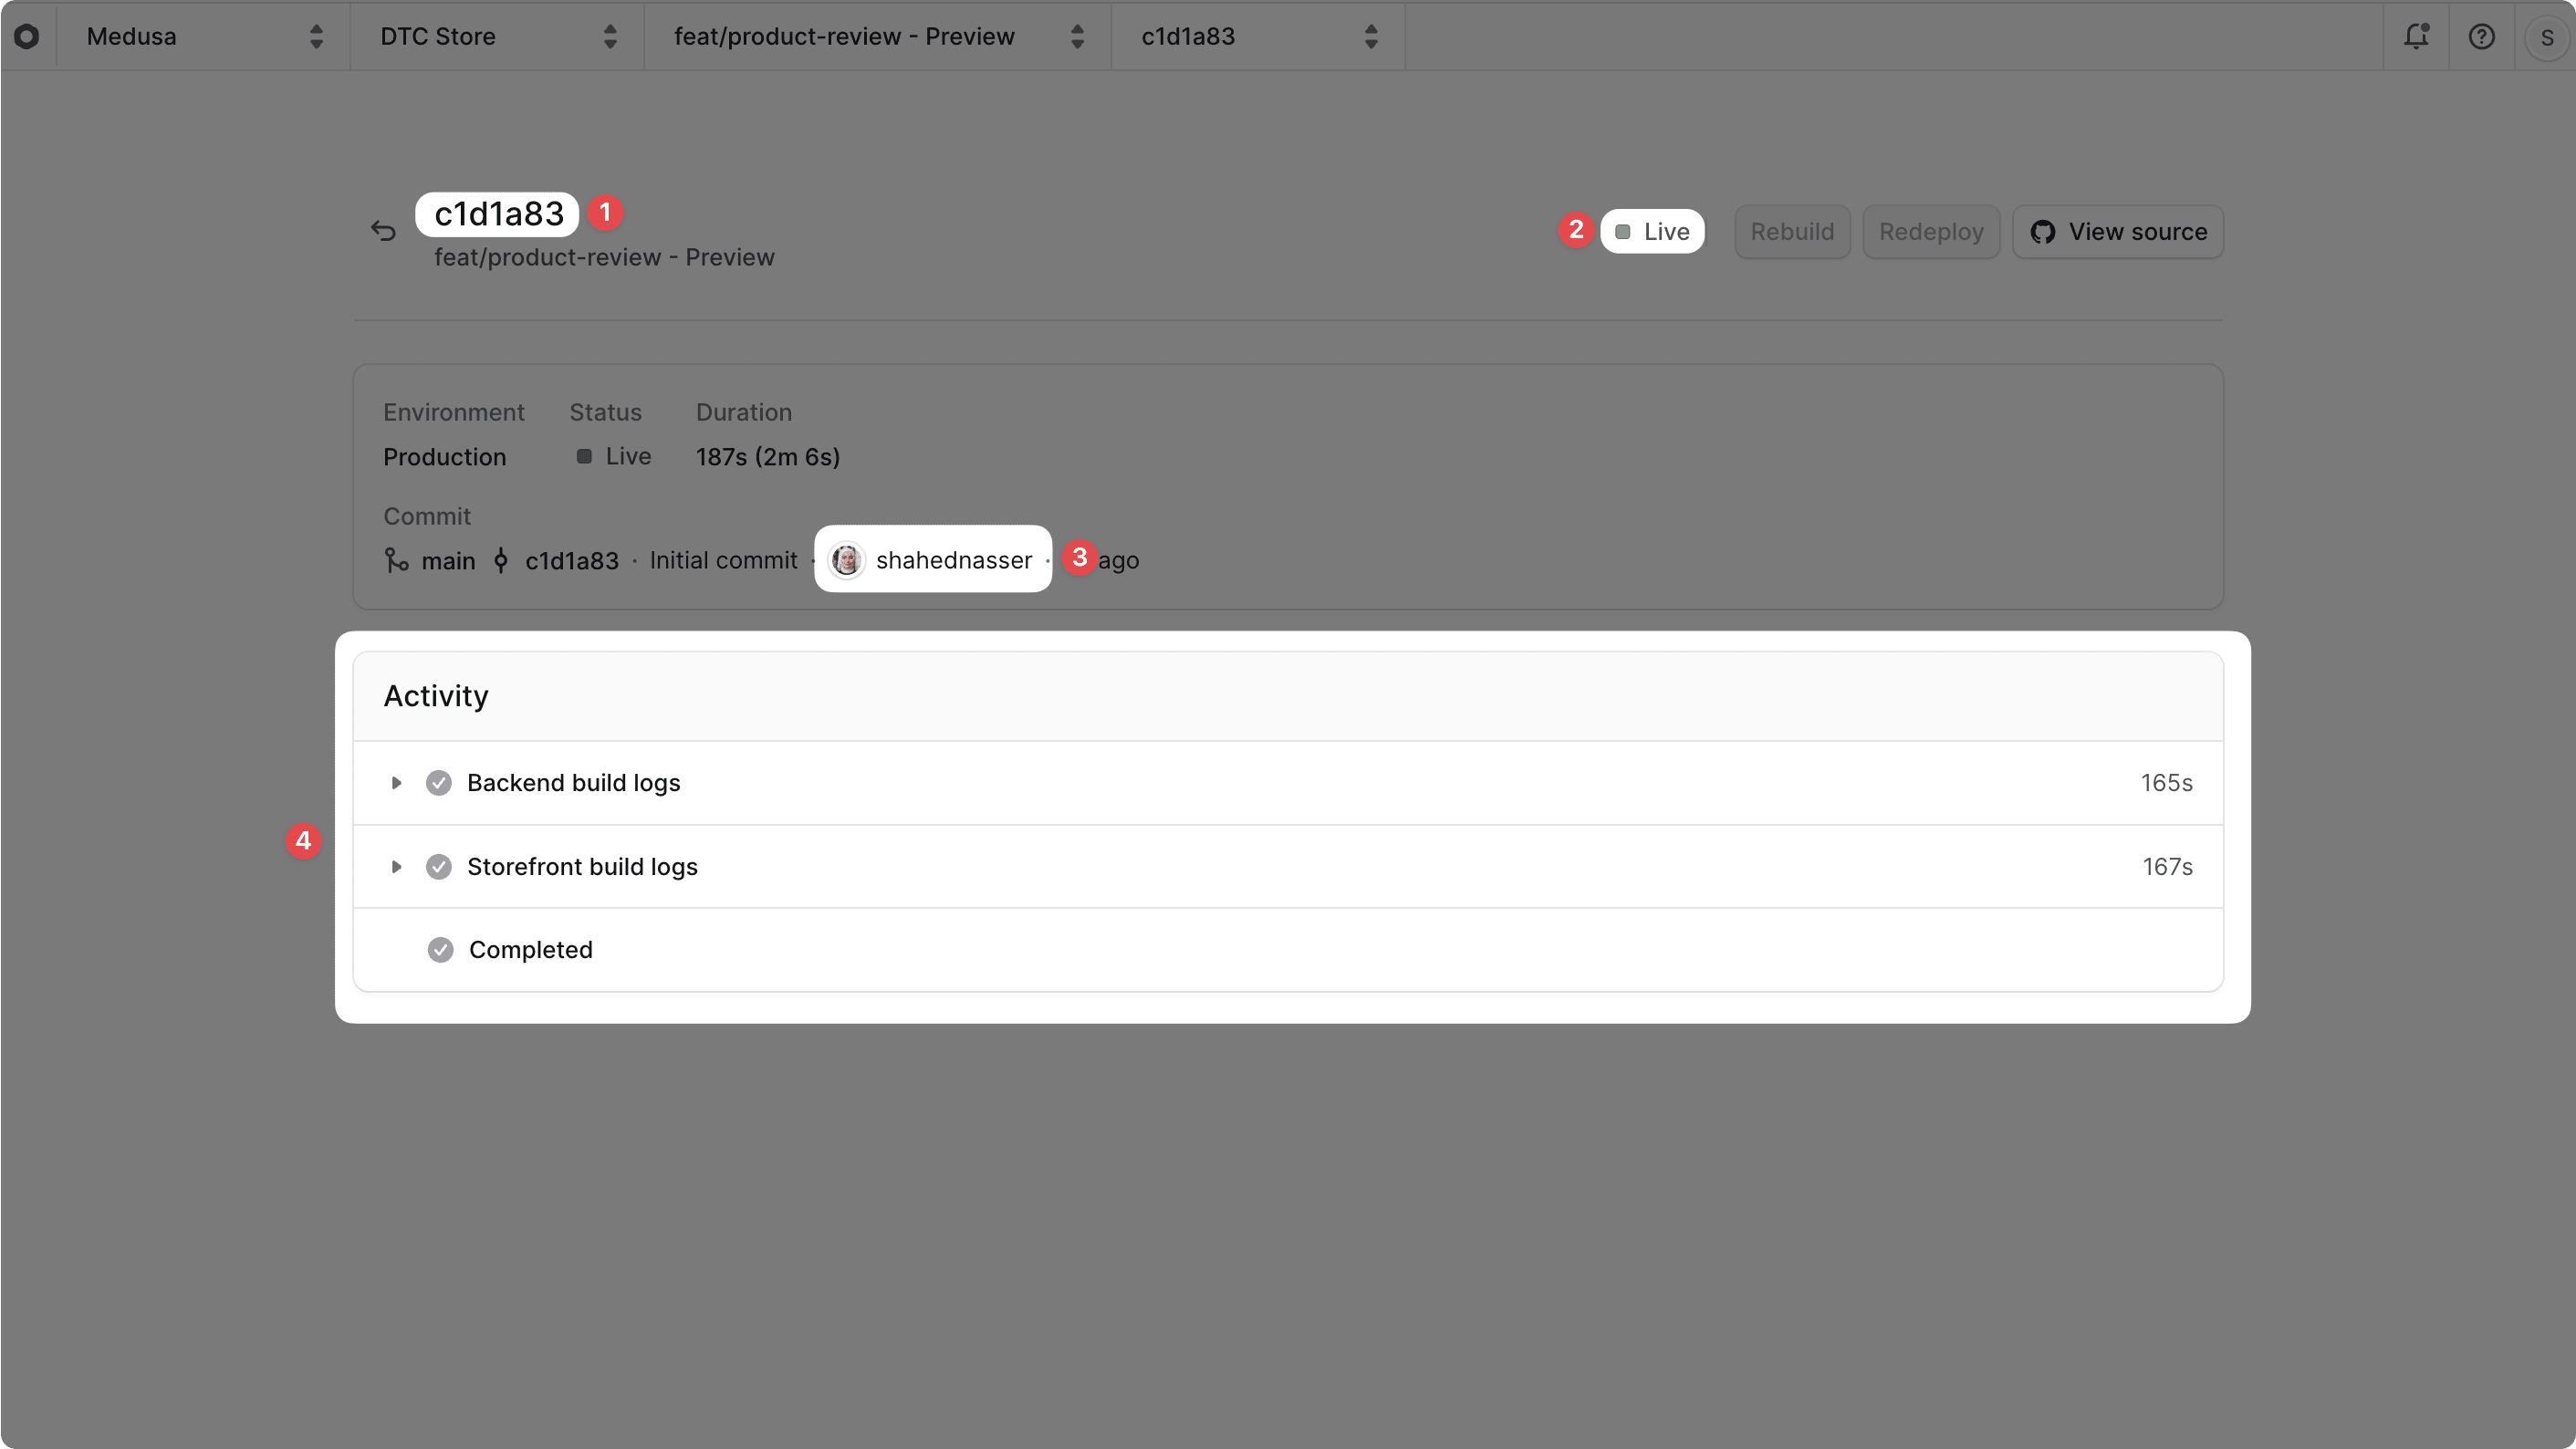
- Commit: The commit that the deployment was created from. This is the page's title.
- Status: The current status of the deployment. For example, "Live" or "Build Failed". You can see it next to the "Redeploy" button.
- Author: The GitHub user who pushed the commit that created the deployment. You can see the user name when you hover over the user's avatar.
- Activity: This section shows the build logs for the backend and storefront (if applicable). They are useful to understand why a deployment failed. Learn more in the Logs guide.
Switch Between Deployments#
The deployment's commit at the top of the Cloud dashboard is also a deployment switcher.
To switch to a different deployment:
- Click on the deployment's commit at the top of the Cloud dashboard, next to the environment's name.
- Choose the deployment you want to switch to from the dropdown.
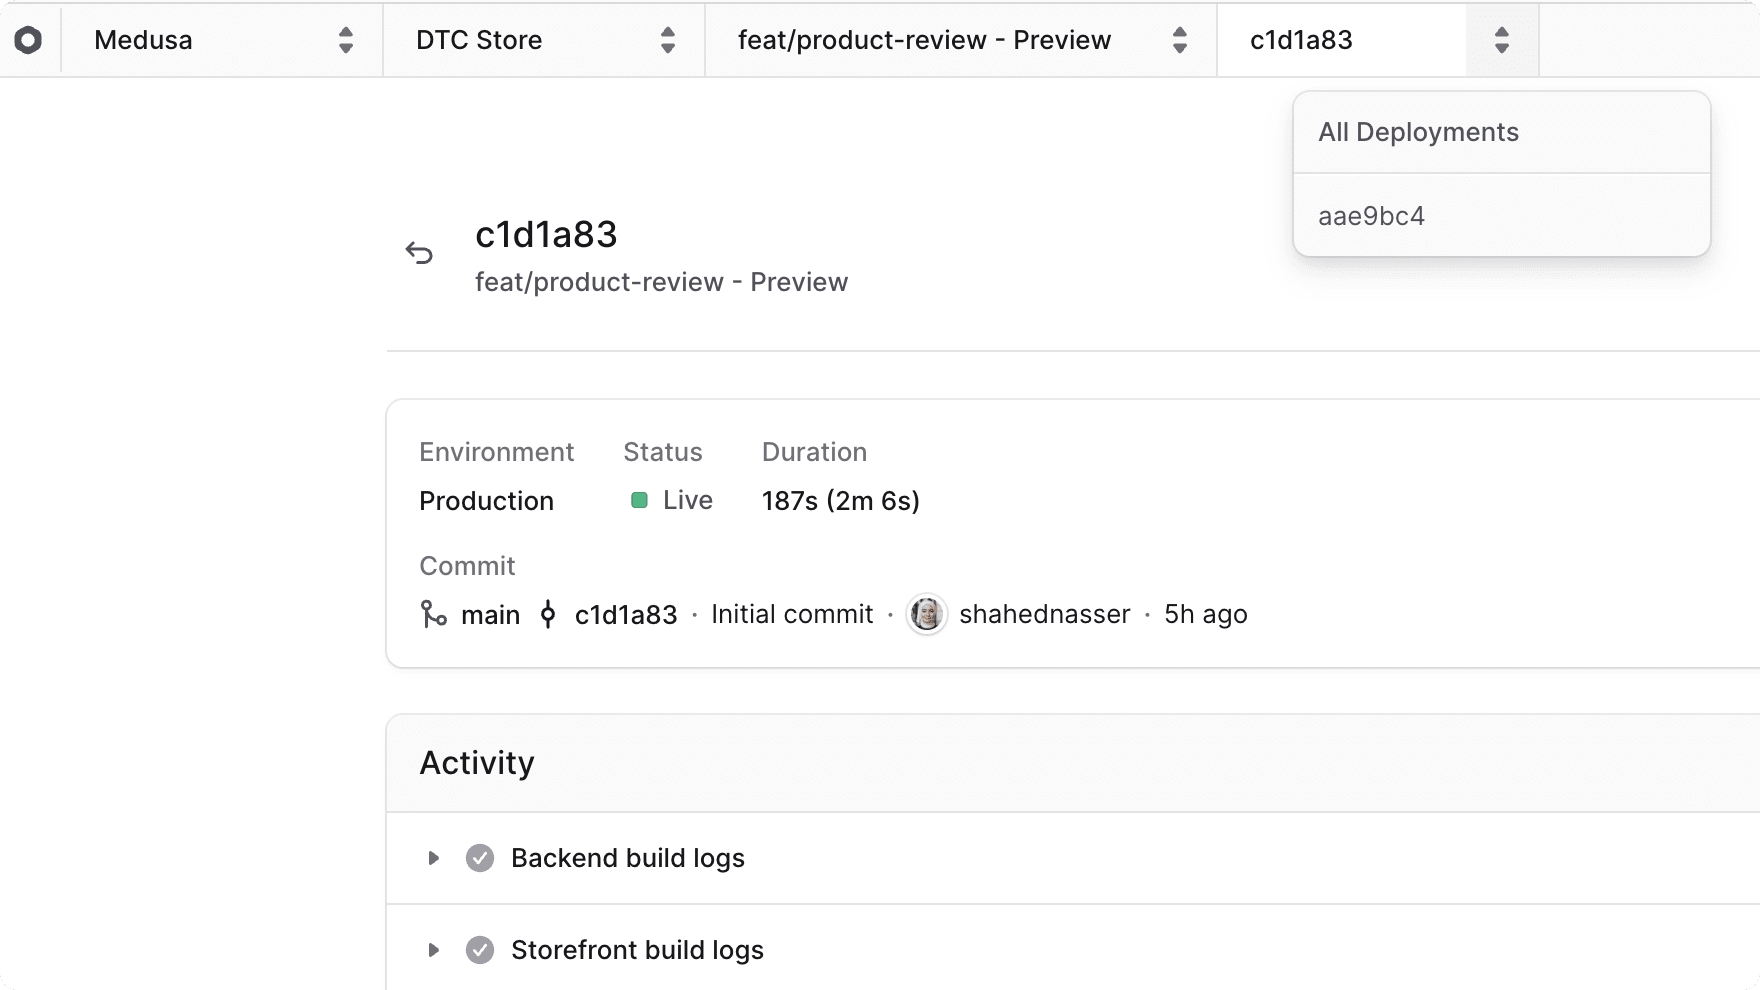
This will change the view to the selected deployment and you'll see its details and logs.
Deployment Statuses and Lifecycle#
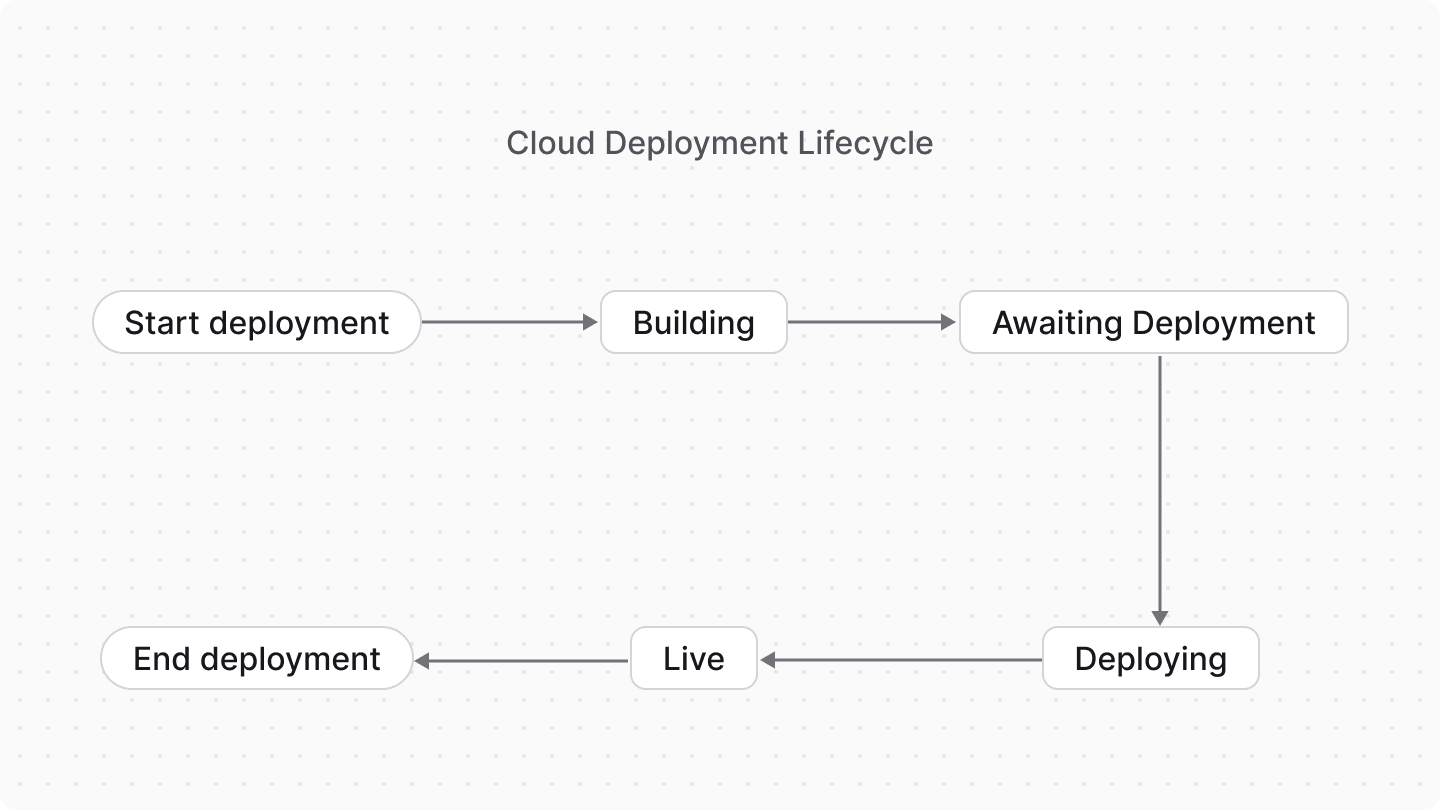
A deployment can have one of the following statuses:
Status | Description |
|---|---|
Building | The deployment is currently being built. This is the initial status of a deployment. |
Build canceled | The build process was canceled due to a newer commit pushed to the branch, which resulted in a new deployment. |
Build failed | The build process failed due to a build error. You can check the build logs to troubleshoot the issue. |
Awaiting deployment | The deployment has finished building and is waiting to be deployed. |
Deploying | The deployment is currently being deployed. |
Deploy failed | The deployment failed during the deployment process. You can check the Runtime Logs to troubleshoot the issue. |
Live | The deployment finished successfully and is now the live version of the environment. |
Ready | The deployment was previously deployed, but it's not currently the live version of the environment. This happens when a new deployment becomes the live version. |
So, the lifecycle of a successful deployment is Building → Awaiting deployment → Deploying → Live. Then, once a new deployment is created, the previous deployment's status changes to Ready.
Access Live Deployment#
Once a deployment's status is "Live", you can access its Medusa Admin, send requests to its API routes, and access its storefront (if applicable).
Learn more in the Access Live Deployment guide.
Troubleshooting Failed Deployments#
Troubleshooting Build Failures#
If a deployment's status is "Build failed", you can check the build logs to understand why it failed. The build logs will show you the errors that occurred during the build process, which can help you fix the issue in your code.
You can also contact support for help with the issue, if necessary.
Troubleshooting Deployment Failures#
If a deployment's status is "Deploy failed", you can check the runtime logs to understand why it failed. The runtime logs will show you the errors that occurred during the deployment process, which can help you fix the issue in your code.
You can also contact support for help with the issue, if necessary.
Redeploy a Deployment#
You might need to redeploy an old deployment if there are unexpected issues with the current live deployment.
By redeploying a previous deployment, you revert or rollback the live version of its environment to the code in that deployment's commit.
To redeploy a deployment:
- Go to the deployment's details page.
- Click the "Redeploy" button at the top right of the page.
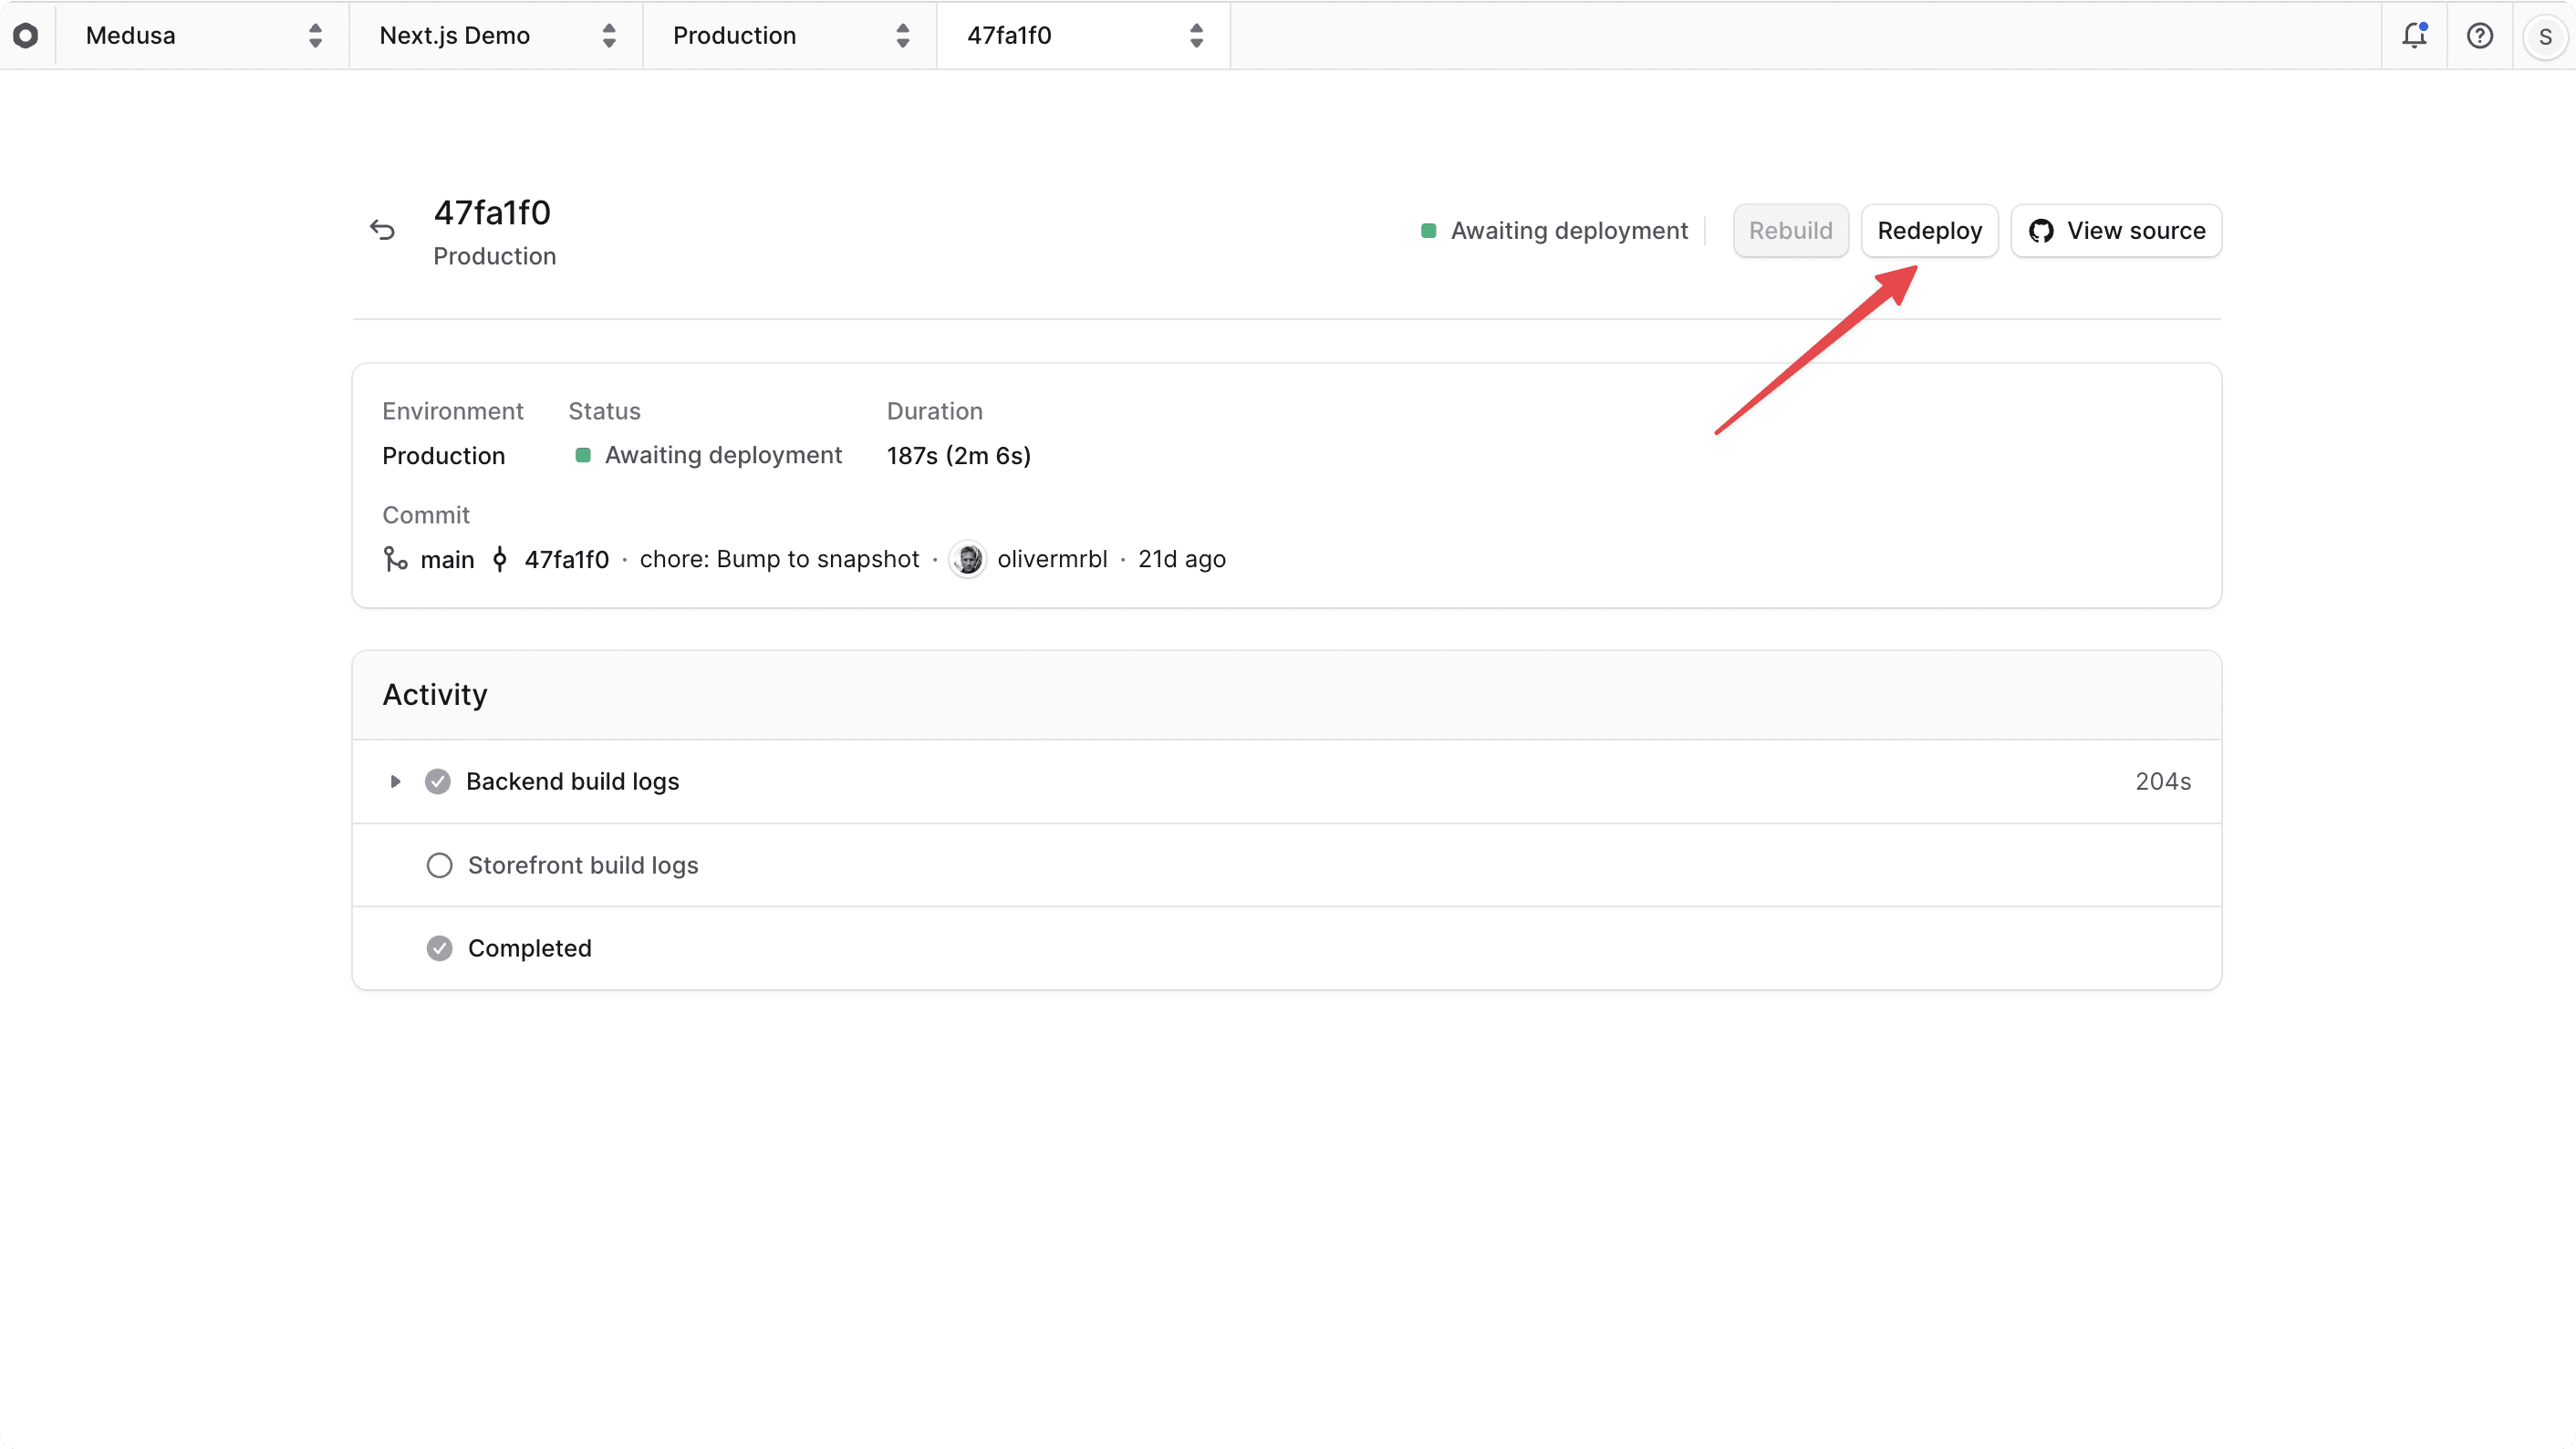
This will trigger the redeployment process for the selected deployment. The deployment will go through the same lifecycle as a new deployment.
Once the redeployment is complete, the deployment's status will change to "Live" and it will become the new live version of the environment.
Change Deployment Rules#
For each environment, you can change the rules that trigger a new deployment. For example, you can change the branch that the environment is connected to, which changes when a new deployment is created.
To change the deployment rules for an environment:
- Go to the environment's dashboard.
- Click on the "Settings" tab.
- Click on the "Deployment rules" tab in the sidebar.
- You'll find a
branchrule. You can edit it by clicking the icon and choosing "Edit" from the dropdown.

- In the side window that opens, you can change the branch that the environment is connected to. For example, you can change it from
maintostagingto create a new deployment every time you push a commit to thestagingbranch. - Click "Save" to apply the changes.
The deployment rules will take effect for next deployments. For example, if you change the branch to staging, the next deployment will be created from the latest commit in the staging branch.
